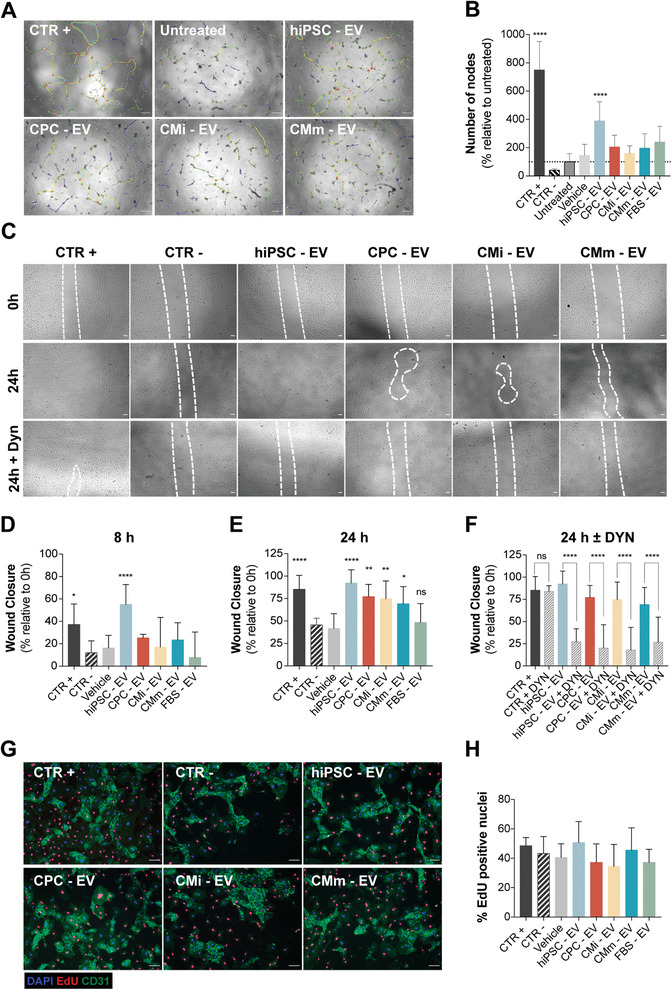
Figure 3.

hiPSC‐EV promote angiogenesis and migration in HUVEC. A) Angiogenic potential of EV samples, evaluated as tube formation at 8 h post‐seeding. The number of nodes (pink dots), master junctions (pink circles), master segments (yellow), meshes (light blue), branches (green), and isolated segments (blue) are shown. Scale bar: 100 µm. B) Tube formation measured as percentage of number of nodes formed in the assay, relative to the untreated control (taken as 100%). Fully supplemented medium was used as positive control, 5 × 10⁻⁶ m Suramin Sodium Salt prepared in basal medium as negative control, basal medium as untreated control, and 8–9 fractions of a blank gradient as vehicle control. C) Effect of EV treatment on HUVEC migration evaluated by the wound healing assay. Representative images of cell migration at 0 and 24 h post‐scratch, with and without EV uptake inhibition by Dynasore (50 × 10−6 m). Scale bar: 100 µm. Wound closure at D) 8 h and E) 24 h post‐scratch. F) Wound closure at 24 h, with and without EV‐uptake inhibition, mediated by Dynasore (50 × 10−6 m). Wound closure measured as a percentage of the initial wound area. Fully supplemented medium was used as positive control, basal medium supplemented with 0.5% fetal calf serum minus growth factors, as negative control and 8–9 fractions of a blank gradient as vehicle control. G) HUVEC proliferation in the wound healing assay, assessed by EdU incorporation (red). HUVEC were stained for the transmembrane protein CD31 (green) and nuclei were counterstained with DAPI (blue). Purple nuclei in merged images correspond to proliferating cells. Scale bar: 100 µm. H) Quantification of EdU‐positive cells from five randomly selected fields per well, equivalent to a minimum of 1000 DAPI‐stained nuclei per experiment. No significant differences were observed for any of the samples. In (B), (D), (E), (F), and (H), results are plotted as mean ± SD (n = 3). In (B), (D), (E), and (H), significance was tested against the negative control. *p < 0.05, **p < 0.01, ****p < 0.0001, n.s. (p > 0.05) by one‐way ANOVA with Dunnett's multiple comparisons test, with a single pooled variance. In (F), significance was tested by one‐way ANOVA with Sidak's multiple comparisons test, with a single pooled variance. ****p < 0.0001, n.s. (p > 0.05). CTR+: positive control, CTR−: negative control.
