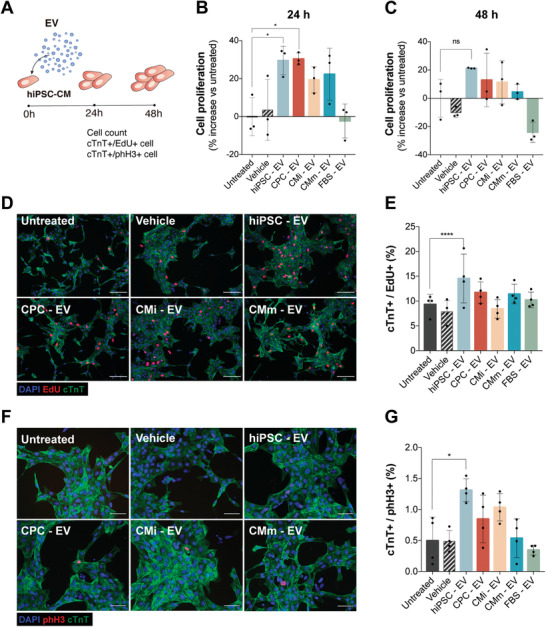
Figure 4.

hiPSC‐EV promote hiPSC‐CM short‐term proliferation. A) Schematic of EV bioactivity assays on hiPSC‐CM. hiPSC‐CM were plated at a third of the normal seeding density (≈100 000 cell cm−2) and treated with EV 24 h post‐seeding (0 h). Proliferation was assessed 24 and 48 h after treatment. B,C) Expansion of hiPSC‐CM represented as percentage increase over the untreated control (culture medium without added EV) at 24 and 48 h after treatment, respectively. Eight to nine fractions of a blank gradient were used as vehicle control. D) Immunofluorescence images and E) the quantification of proliferation marker EdU (red), cardiac troponin T (cTnT) (green), and nuclei (blue) in cardiomyocytes. F) Immunofluorescence images and (G) the quantification of mitotic cardiomyocytes assessed by phospho‐Histone H3 (phH3) (red), cTnT (green), and nuclei (blue). Data are mean ± SD [n = 3 in (B) and (C) and n = 4 in (E) and (G)]. Significance was tested against the negative control. *p < 0.05, ****p < 0.0001, n.s. (p > 0.05) by one‐way ANOVA with Dunnett's multiple comparisons test, with a single pooled variance.
