Figure 5.

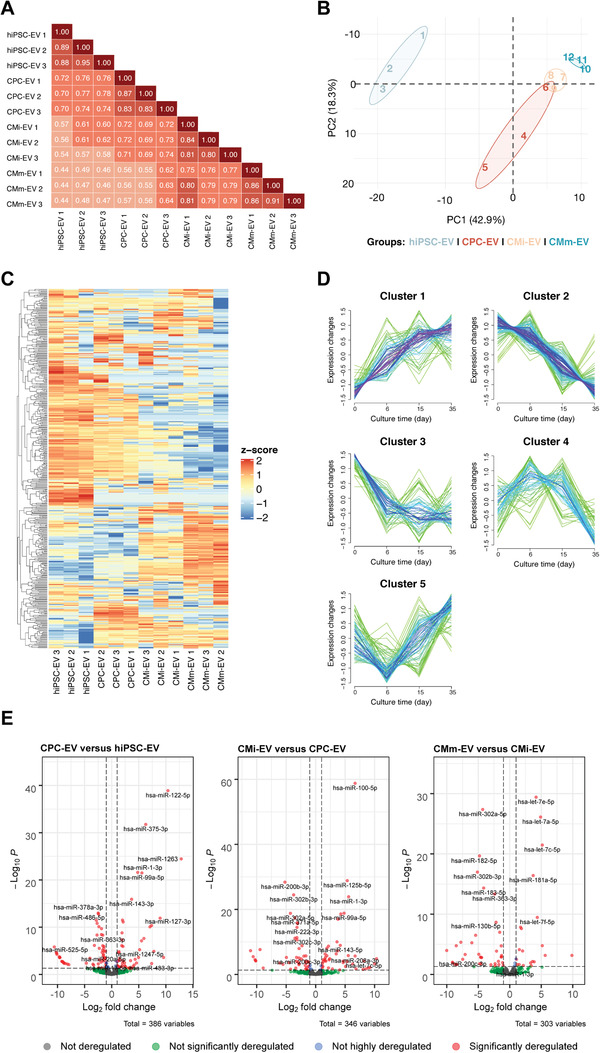
EV miRNome reflects the cellular changes that occur during hiPSC‐CM differentiation. A) Pearson's correlation analysis revealed a moderate degree of similarity between the miRNA expression profiles of all EV populations. B) Principal component analysis (PCA) shows a highly significant discrimination of the miRNA expressed between EV from different cell populations. C) Heatmap representing the z‐score normalized global miRNA expression in three biological replicates of hiPSC‐EV, CPC‐EV, CMi‐EV, and CMm‐EV, with a number of reads greater than a mean of 5 in at least one EV population. Dendrograms are based on complete‐linkage hierarchical clustering and Euclidean distances. D) Fuzzy plots representing the dynamic expression of five distinguishable miRNA clusters found in EV along hiPSC‐CM. E) Volcano Plots with pairwise comparisons of significantly differentially expressed miRNAs between EV populations (Log FC ≥ |−1| and p ≤ 0.05). All results correspond to EV from three independent isolations, corresponding to three different batches of conditioned culture media (n = 3).
