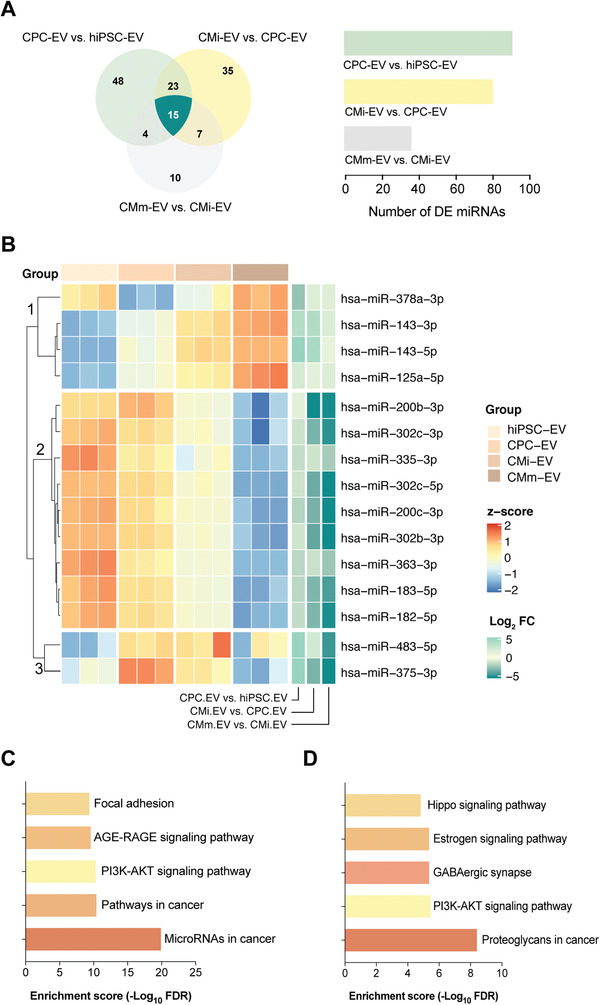
Figure 6.

An EV‐miRNA cluster is differentially expressed throughout hiPSC‐CM differentiation. A) Venn diagram representation of the unique and shared differentially regulated miRNA between CPC‐EV versus hiPSC‐EV (light green), CMi‐EV versus CPC‐EV (yellow), and CMm‐EV versus CMi‐EV (gray). B) Heatmap and dendrograms of z‐score normalized miRNA expression levels illustrating the 15 common differentially expressed miRNA obtained in (A). miRNAs are clustered based on k‐means (clusters 1, 2, and 3). Fold changes (in log scale) are shown on the right side of the plot. C,D) Pathway enrichment analysis for miRNA in cluster 2 of the heatmap shown in (B). C) Top 5 KEGG (Kyoto Encyclopedia of Genes and Genomes) pathways for experimentally validated targets of miRNA obtained with Ingenuity Pathway Analysis. D) Top 5 KEGG pathways for miRNA obtained with DIANA‐miRPath v3.0.
