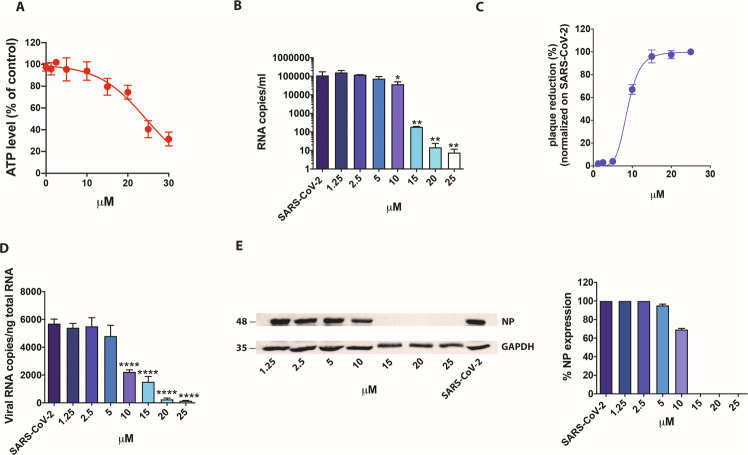
Fig. 2. Effect of raloxifene on Calu-3 cells.
Calu-3 cells were cultured for 48 h in absence or in the presence of raloxifene at different concentrations. A CellTiter-Glo was used to measure the antimetabolic effect of raloxifene. B–E Cells were infected with SARS-CoV-2 and cultured in the absence or in the presence of different doses of raloxifene. B Viral yield in cell supernatants was quantitated by qRT-PCR. C Viral titer in cell supernatants was evaluated by plaque assay and plotted as percentage of plaque reduction compared to SARS-CoV-2. D Quantitation of SARS-CoV-2 genomes at the intracellular level by qRT-PCR. E Nucleocapsid (NP) protein expression in infected cells was analyzed by western blot (left panel). Densitometric analyses of western blot results are shown. Graph represents the percentage of NP protein expression. All the experiments were performed at least in three independent replicates and pictures shown are representative. Data are presented as the mean + standard error of the mean *P < 0.05; **P < 0.01; ****P < 0.0001.

