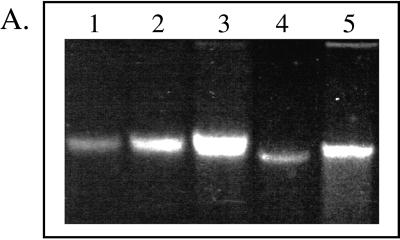
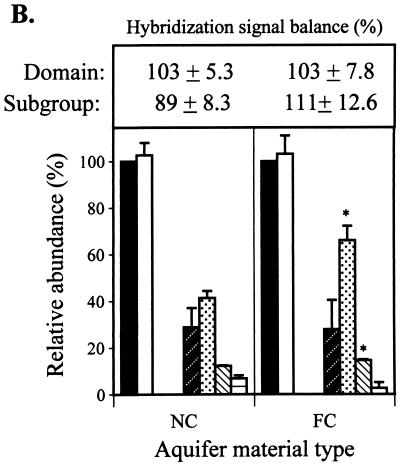
FIG. 1.
(A) Agarose gel analysis of DNA extracted from aquifer
field samples and standards. Lanes 1 to 3, Pseudomonas
genomic DNA loaded at 0.59, 1.18, and 2.47 μg; lanes 4 and 5,
aliquots (10 μl) of purified DNAs extracted from the NC or FC
sediment (total volumes of the DNA extracts were 100 and 600 μl for
the NC and FC extracts, respectively). (B) Relative abundance
(universal probe-normalized signals) of domains and subgroups (phylum
and subclass levels) in the NC and FC aquifer samples. The sums of
domain and subgroup hybridization signals (± standard deviations) are
given in the box above the graph. Legend for probe target groups: ■,
universal; □, Bacteria;
 ,
Eucarya;
 , ALF;
, B+G;
 , SRB;
 , HGC. Data are
means of duplicate measurements (± standard deviations). An asterisk
indicates that the hybridization signal from a given probe differed
significantly (P ≤ 0.05) from that for the nonamended
control.


