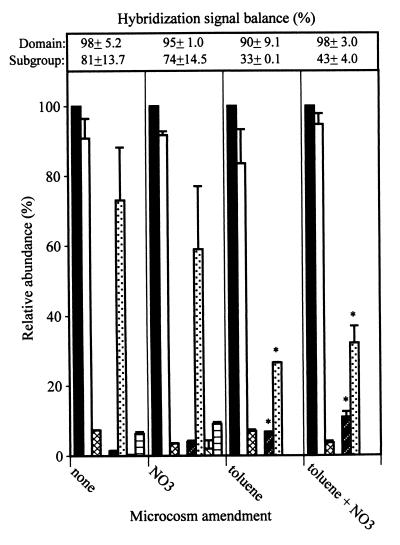
FIG. 3.
Molecular analysis of DNA extracted from microcosms established with the FC aquifer material. Relative abundance of the domain or subgroups was determined by hybridization to the indicated probe (see the legend to Fig. 1 for the key to probe abbreviations). Bars marked with an asterisk were significantly different (P ≤ 0.05) from those for the nonamended microcosms. Probes for which data are not plotted gave hybridization signals that were below background.

