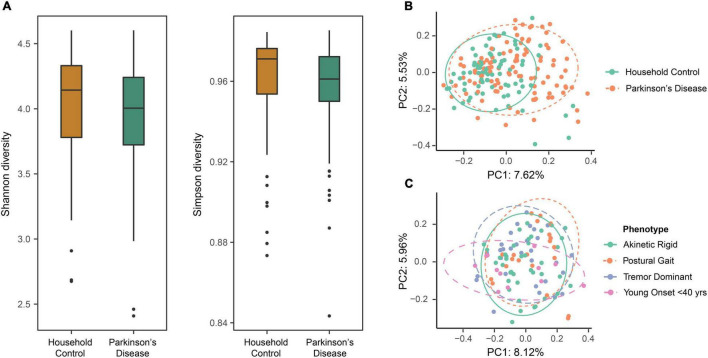
FIGURE 1.
The evaluation of diversity measures between the household control (HC) and Parkinson’s disease (PD) groups identified differences in beta diversity measures but not alpha diversity. (A) Box plots representing alpha diversity showed no significant differences in Shannon (species abundance and evenness within a community) or Simpson (species richness and evenness within a community) diversity between the HC and PD cohorts (ANOVA, p = 0.057 and 0.159, respectively). (B) Beta diversity using principal coordinate analysis (PCoA) with Bray-Curtis dissimilarity at amplicon sequence variant (ASV) level. Comparison of the first two principal components revealed varied beta diversity (extent of species diversity difference between two environments) between the groups (PERMANOVA, p < 0.0001), suggestive of a disease-related effect on GM composition that might define a PD-related GM profile. Colored ellipses (solid green = HC and dotted orange = PD) represent a 90% confidence region and the proportion of total variance represented by a given principal component is labeled on the respective axis. (C) Evaluating the effects of PD phenotypes in terms of gut microbial beta diversity showed no overall statistical significance between the four groups (PERMANOVA, p = 0.112). Although, the greatest diversity difference was seen for the younger onset < 40 years subgroup, as compared to the tremor dominant, akinetic rigid and postural instability subgroups.

