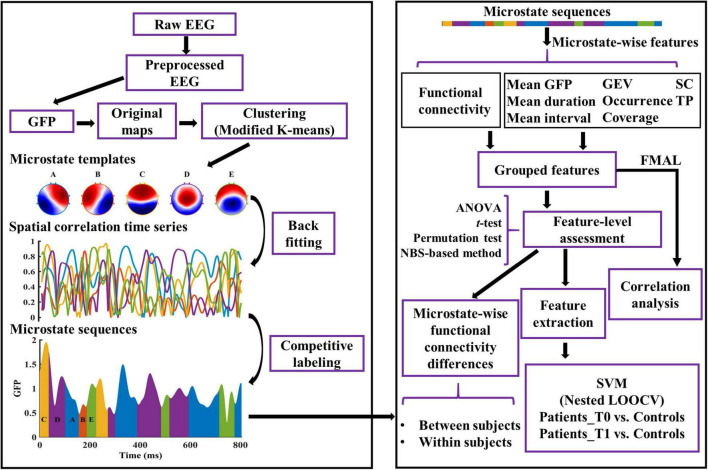
FIGURE 1.
Graphical representation of the analysis method in the study. The microstate templates used in this study are common templates of patients and healthy controls. See “Materials and Methods” section for details. GFP, Global Field Power; GEV, Global Explained Variance; SC, Spatial Correlation metric; TP, Transition Probability; FMAL, Lower-extremity part of Fugl-Meyer Assessment; SVM, Support Vector Machine; LOOCV, Leave-One-Out Cross-Validation.

