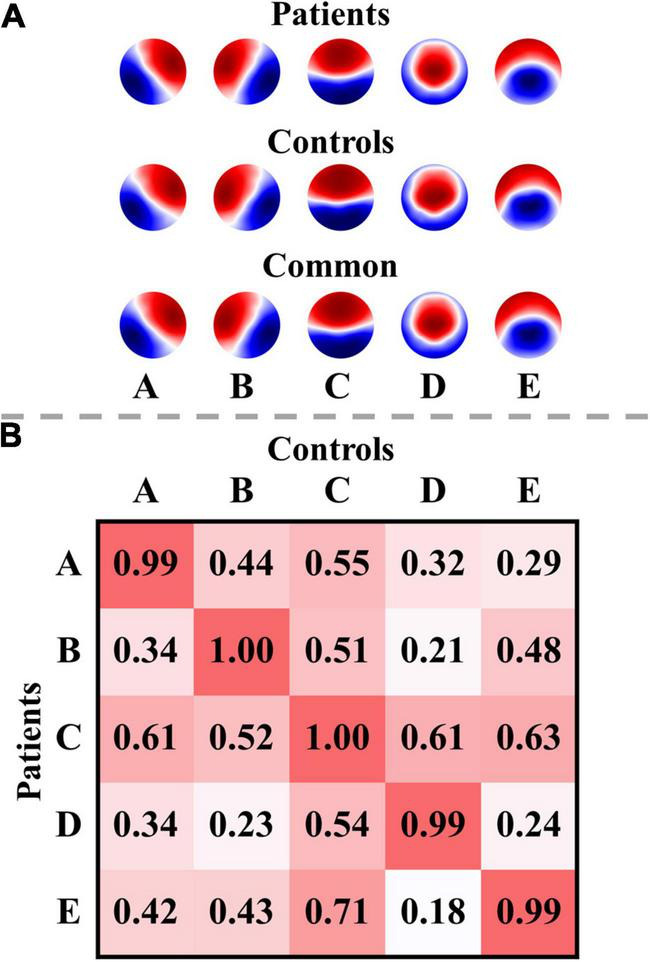
FIGURE 2.

Microstate templates and spatial correlations. (A) Microstate templates. (B) Spatial correlations between the microstate templates of patients and controls. Polarity was ignored when computing the correlations. The templates of the patients were calculated from all their EEG data at T0 and T1.
