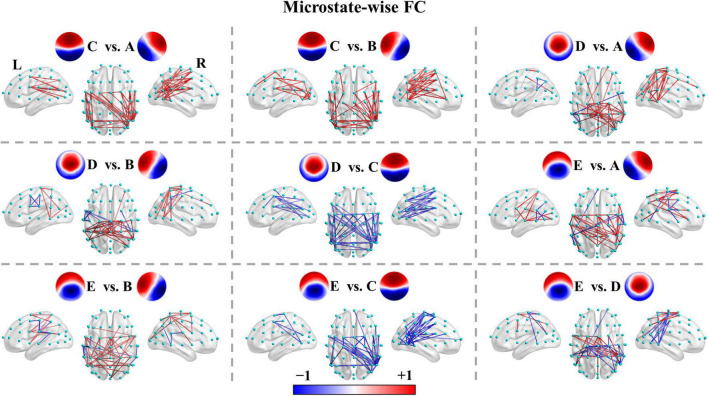
FIGURE 4.
Microstate-wise functional connectivity comparisons in healthy controls. For X vs. Y, the red color indicates greater connectivity for microstate X vs. microstate Y, while the blue color indicates greater connectivity for microstate Y vs. microstate X. Color depth represents the size of the connection difference (t-value). For visual clarity, only the top 50 connections (according to absolute t-values) of the connected components with significant differences (p < 0.05, NBS-based method corrected) are displayed in the figure. The complete significant connected components of the four groups are shown in the first column of Supplementary Figures 4–12.

