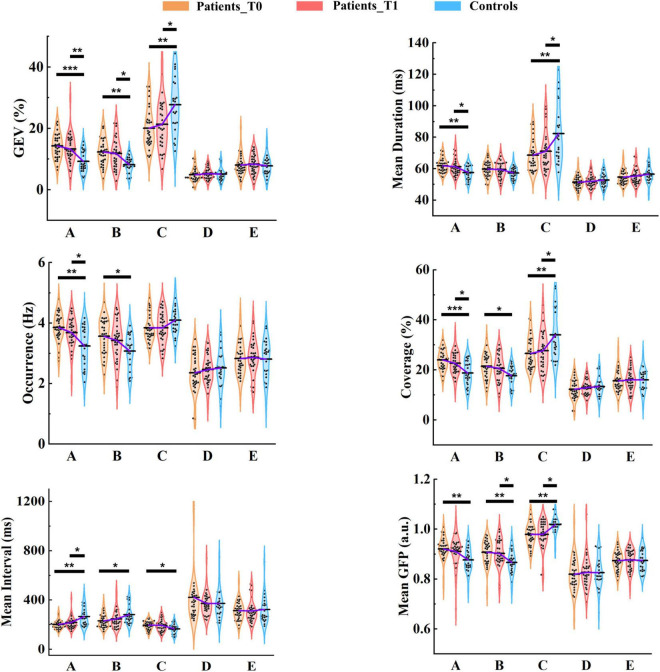
FIGURE 5.
Results of microstate parameter analysis for patients and controls. Post hoc pairwise comparisons (patients at T0 vs. controls; patients at T1 vs. controls) were performed for GEV, mean duration, occurrence, coverage, mean interval, and mean GFP. The means of the three groups for each microstate class are linked by the solid purple line. *p < 0.05; **p < 0.01; ***p < 0.001.

