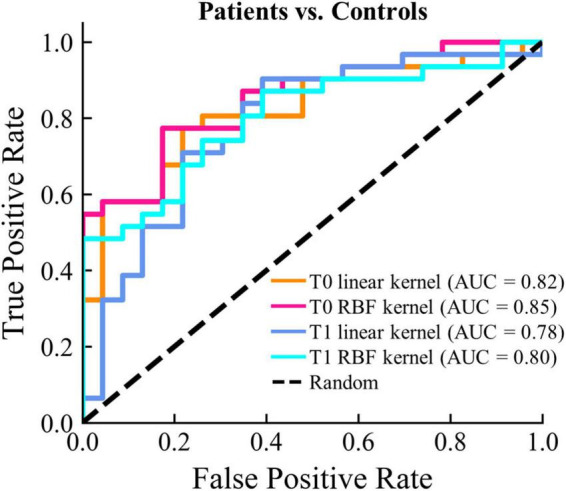
FIGURE 6.

Classifications results between patients and controls. The ROC curve and the corresponding AUC for each classification model are displayed.

Classifications results between patients and controls. The ROC curve and the corresponding AUC for each classification model are displayed.