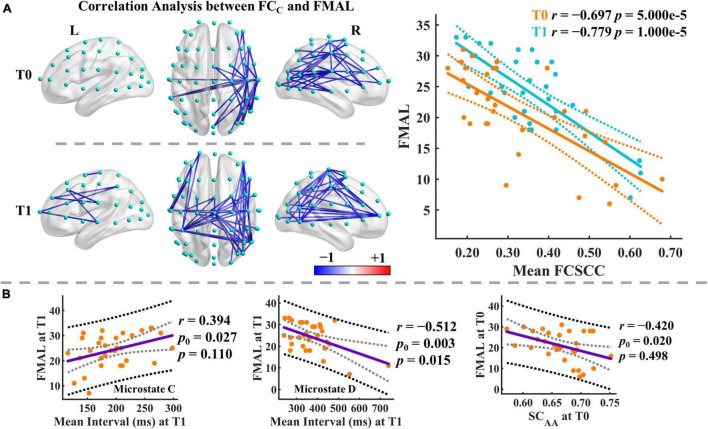
FIGURE 7.
Results of correlation analysis. (A) Correlation analysis between the functional connectivity of microstate C and FMAL score. Only the significant connected components are displayed. Mean FCSCC refers to the mean of the functional connectivity strength within the significant connected component. The blue color indicates negative correlations between the connectivity of microstate C and the FMAL score. Color depth represents the size of the correlation coefficient. Dashed lines imply the 95% confidence intervals for the regression estimates. Pearson correlation coefficient (r) and the corresponding permutation-based p-value are given. (B) Correlation analysis between microstate parameters and FMAL score. The black and gray dashed lines indicate the 95% prediction and 95% confidence intervals, respectively. Pearson correlation coefficient (r) and the corresponding permutation-based p-value are given. p0 is the uncorrected p-value.

