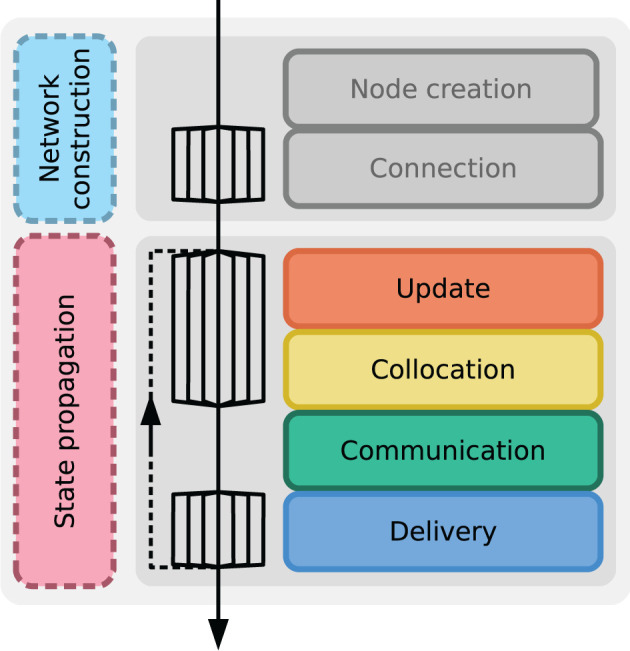
Figure 3.

Instrumentation to measure time-to-solution. Successive phases of a NEST simulation; time is indicated by top-down arrow. Fanning arrows denote parallel operation of multiple threads. The main phases network construction (cyan) and state propagation (pink) are captured by external timers on the Python level. Built-in NEST timers on the C++ level measure sub-phases: node creation and connection (both gray, not used in benchmark plots); update (orange), collocation (yellow), communication (green), and delivery (blue). The sub-phases of the state propagation are repeated until the simulation is finished as shown by the dashed arrow connecting delivery and update.
