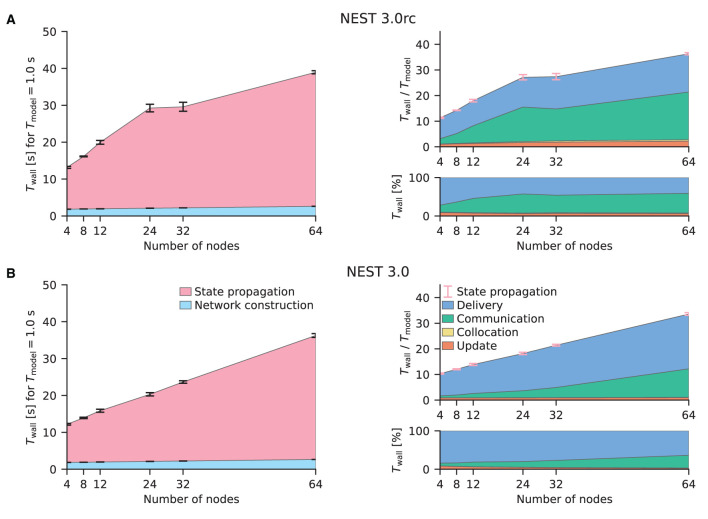
Figure 4.
Weak-scaling performance of the HPC-benchmark model on JURECA-DC. (A) NEST 3.0rc. The left graph shows the absolute wall-clock time Twall measured with Python-level timers for both network construction and state propagation [legend in (B)]; the model time is Tmodel = 1 s. Error bars indicate variability across three simulation repeats with different random seeds. The top right graph displays the real-time factor defined as wall-clock time normalized by the model time. Built-in timers resolve four different phases of the state propagation [legend in (B)]: update, collocation, communication, and delivery. Pink error bars show the same variability of state propagation as the left graph. The lower right graph shows the relative contribution of these phases to the state-propagation time. Same colors used for phases as in Figure 3. (B) NEST 3.0. Same display as (A).

