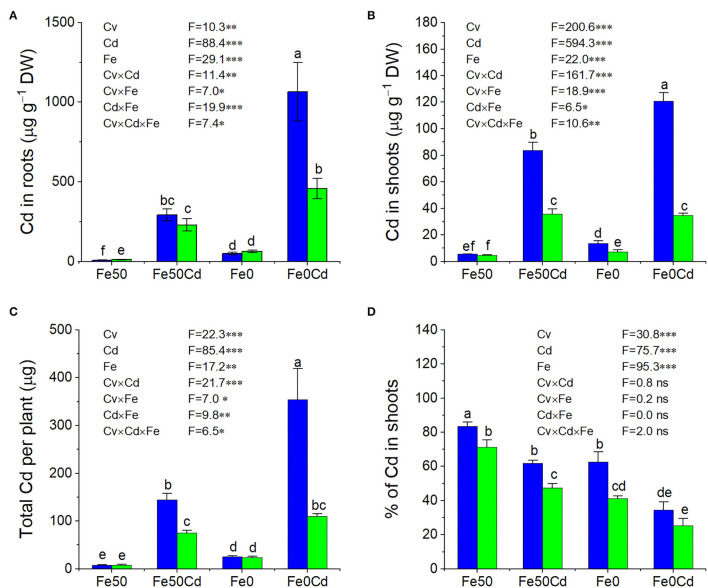
Figure 5.
The concentration of Cd in roots (A), shoots (B), total Cd uptake (C), and translocation of Cd (D) in Fe-sufficient (Fe50) or Fe-deficient (Fe0) plants of Silihong (blue columns) and Fenghua 1 (green columns) exposed to 0 or 2 μM CdCl2 for 14 days. Data (means ± SE, n = 3) shared the same letter(s) above the error bars are not significantly different at the 0.05 level by Duncan's multiple range test.

