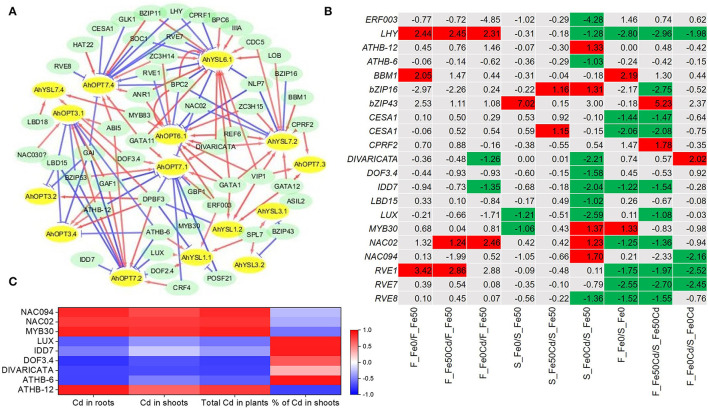
Figure 7.
Predicted transcription factors (TFs) of differentially expressed AhOPT genes. (A) Co-expression network of TFs-AhOPTs. The red and blue lines represent positive and negative correlations between TFs and AhOPTs, respectively. (B) Differentially expressed TFs in Fe-sufficient (Fe50) or Fe-deficient (Fe0) roots of Silihong (S) and Fenghua 1 (F) exposed to 0 or 2 μM CdCl2. (C) Correlation between the expression of TFs and Cd accumulation.

