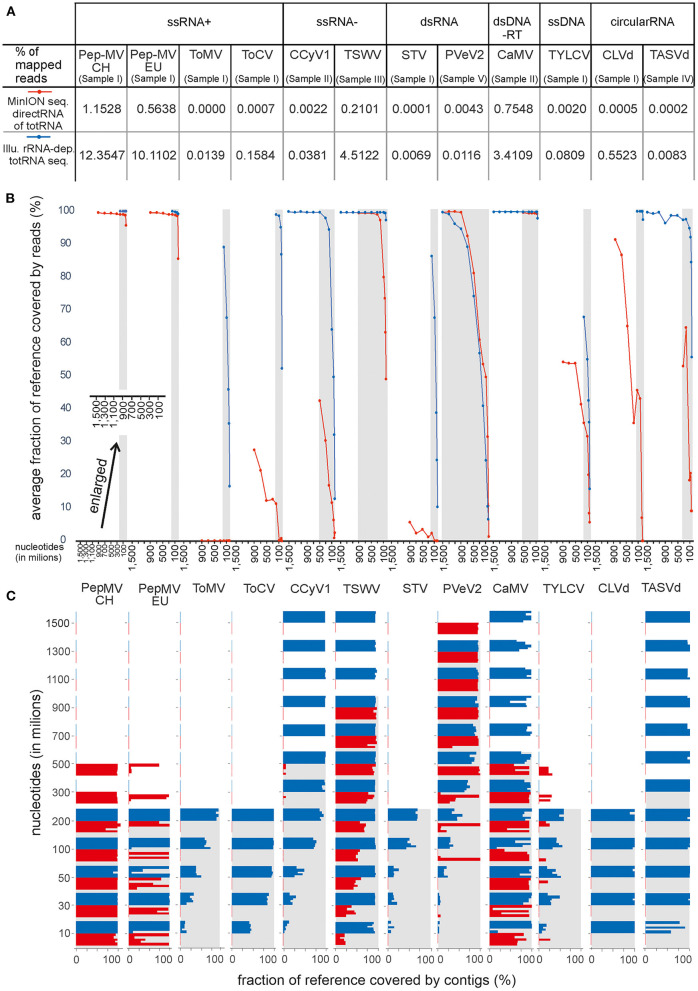
Figure 3.
Comparison of MinION direct RNA sequencing of totRNA (represented inred) and Illumina sequencing of rRNA-depleted totRNA (represented in blue) using data size-normalized subsamples. Results for each virus included in the analysis are shown along the x-axis and are grouped according to Baltimore classification. (A) Percentage of specific virus reads in trimmed and filtered complete HTS datasets. (B) Average fraction of reference covered by reads (%) at different subsample sizes. Dots represent the average value of analysis of 5 replicate subsamples. Different subsample sizes were used (10, 30, 50, 100, 200, 300, 500, 700, 900, 1,100, 1,300, 1,500 million nts–note the enlarged x-axis in the lower left part of panel 3B for a clearer view). (C) Fraction of reference covered by contigs (%) at different subsample sizes. Every bar represents the result of analysis for separate replicate subsamples. In (B,C), gray areas designate the range in which the subsamples were available for both approaches compared.

