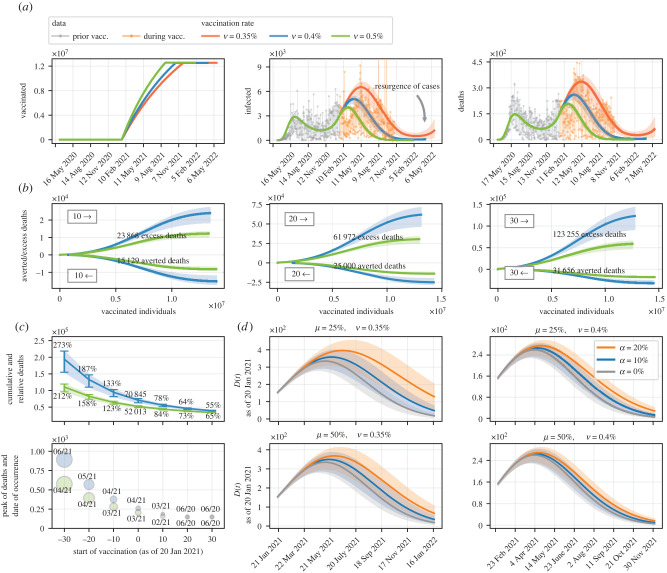
Figure 4.
Flawed vaccination policy and excess deaths. (a) Model simulation where part of the population eligible to be vaccinated does not receive any dose. (b) Ratio between the number of deaths given potential scenarios in which the start of vaccination is ahead of the actual date. Scenarios where vaccination would be implemented 10, 20 and 30 days before 20 January 2021 are considered, as well as two vaccination rates ( and ), and excess deaths are estimated. (c) Variation in the cumulative number of deaths and the number of deaths at the peak of the epidemic curve (during vaccination) taking into account the start of vaccination on different days. The relative percentage amount of cumulative deaths is shown, as well as the month in which deaths would peak. (d) Simulation considering that part of the population proportional to α does not take the second dose of the vaccine. Two scenarios are considered in which only the first dose of the vaccine has efficacy equivalent to μη, combined with two vaccination rates ( and ). The solid line represents the simulation using the MAP value and the shaded areas represent the 95% credible interval.

