. 2022 Feb 1;303(3):682–692. doi: 10.1148/radiol.213072

Figure 4:

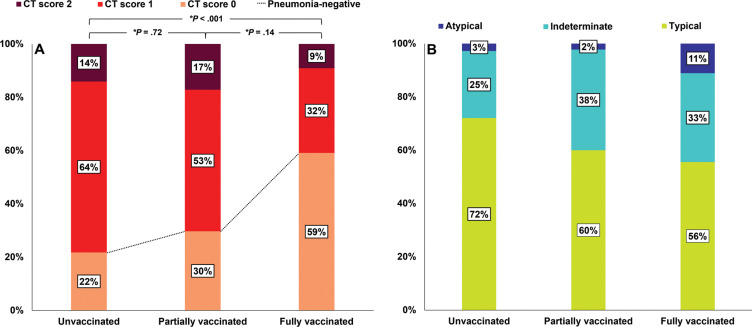
Bar graphs show (A) CT scores and (B) patterns for the 412 patients who underwent chest CT during hospitalization according to vaccination status. (A) The proportion of patients with a CT score of 0 was significantly greater in the fully vaccinated group than in the unvaccinated group (P < .001). * = Bonferroni-adjusted P value, which was determined by multiplying the raw P value by 3. (B) Among patients with pneumonia, CT patterns were not significantly different between the groups (P = .22).

Bar graphs show (A) CT scores and (B) patterns for the 412 patients who underwent chest CT during hospitalization according to vaccination status. (A) The proportion of patients with a CT score of 0 was significantly greater in the fully vaccinated group than in the unvaccinated group (P < .001). * = Bonferroni-adjusted P value, which was determined by multiplying the raw P value by 3. (B) Among patients with pneumonia, CT patterns were not significantly different between the groups (P = .22).