. 2022 Feb 1;303(3):682–692. doi: 10.1148/radiol.213072

Figure 5:

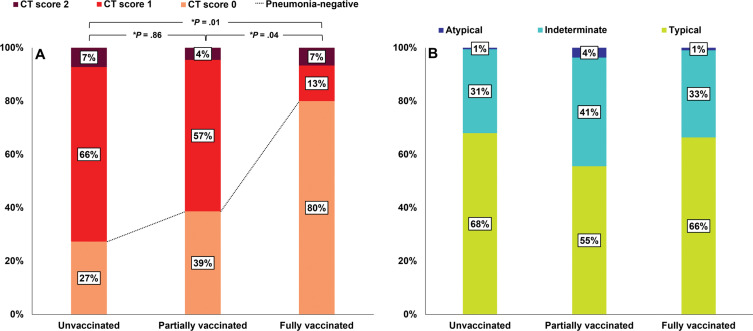
Bar graphs show CT scores and patterns of the 308 patients at center 1 according to vaccination status. At center 1, patients with asymptomatic or mild symptoms were hospitalized and initial chest CT scans were obtained in all patients. (A) The proportion of patients with a CT score of 0 was significantly greater in the fully vaccinated group than in the partially or unvaccinated groups (P = .04 and .01, respectively). * = Bonferroni-adjusted P value, which was determined by multiplying the raw P value by 3. (B) Among patients with pneumonia, CT patterns were not significantly different between the groups (P = .46).

Bar graphs show CT scores and patterns of the 308 patients at center 1 according to vaccination status. At center 1, patients with asymptomatic or mild symptoms were hospitalized and initial chest CT scans were obtained in all patients. (A) The proportion of patients with a CT score of 0 was significantly greater in the fully vaccinated group than in the partially or unvaccinated groups (P = .04 and .01, respectively). * = Bonferroni-adjusted P value, which was determined by multiplying the raw P value by 3. (B) Among patients with pneumonia, CT patterns were not significantly different between the groups (P = .46).