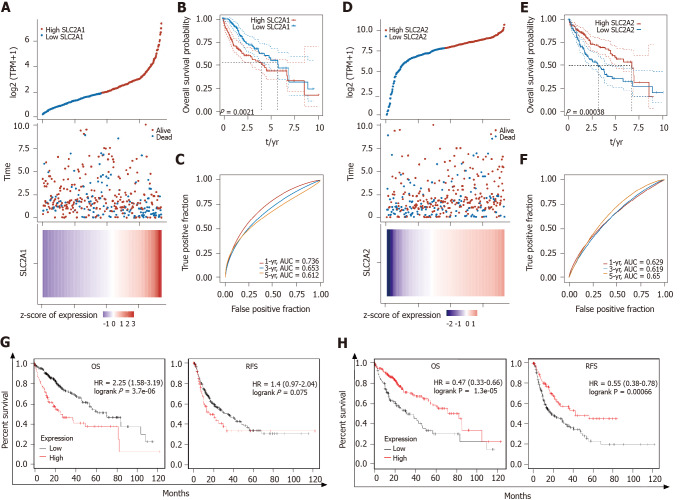
Figure 4.
Solute carrier family 2 member 1 and solute carrier family 2 member 2 messenger RNA levels were correlated with survival rates of hepatocellular carcinoma patients in The Cancer Genome Atlas data and the Kaplan-Meier Plotter database. A: In The Cancer Genome Atlas (TCGA) database, the top graph represents the scatter graph of solute carrier family 2 member 1 (SLC2A1) expression from low to high, where the blue represented the low expression group and the red represented the high expression group. The middle graph represents the scatter graph of the survival time and survival state corresponding to the SLC2A1 expression level of different samples. The bottom graph is a heat map of the expression of SLC2A1 in diverse samples; B: According to the expression level of SLC2A1, the patients were divided into the high expression group and the low expression group, and the results suggested that the low expression group had better overall survival (OS); C: Area under the curve (AUC) of SLC2A1 in 1, 3, and 5 years. The higher the value was, the stronger the predictive ability of the gene was; D: In TCGA database, the top graph represents the scatter graph of solute carrier family 2 member 2 (SLC2A2) expression from low to high, where the blue represents the low expression group and the red represents the high expression group. The middle graph represents the scatter graph of the survival time and survival state corresponding to the SLC2A2 expression level of different samples. The bottom graph is a heat map of the expression of SLC2A2 in diverse samples; E: According to the expression level of SLC2A2, the patients were divided into the high expression group and the low expression group and the results suggested that the low expression group had poor OS; F: AUC of SLC2A2 in 1, 3, and 5 years. The higher the value was, the stronger the prognostic ability of the gene; G: Hepatocellular carcinoma (HCC) patients with high expression of SLC2A1 had poorer OS [hazard ratio (HR): 2.25, P = 3.7e-06] and relapse-free survival (RFS) (HR: 1.4, P = 0.075); H: HCC patients with high expression of SLC2A2 had better OS (HR: 2.25, P = 3.7e-06) and RFS (HR: 0.55, P = 6.6e-04).

