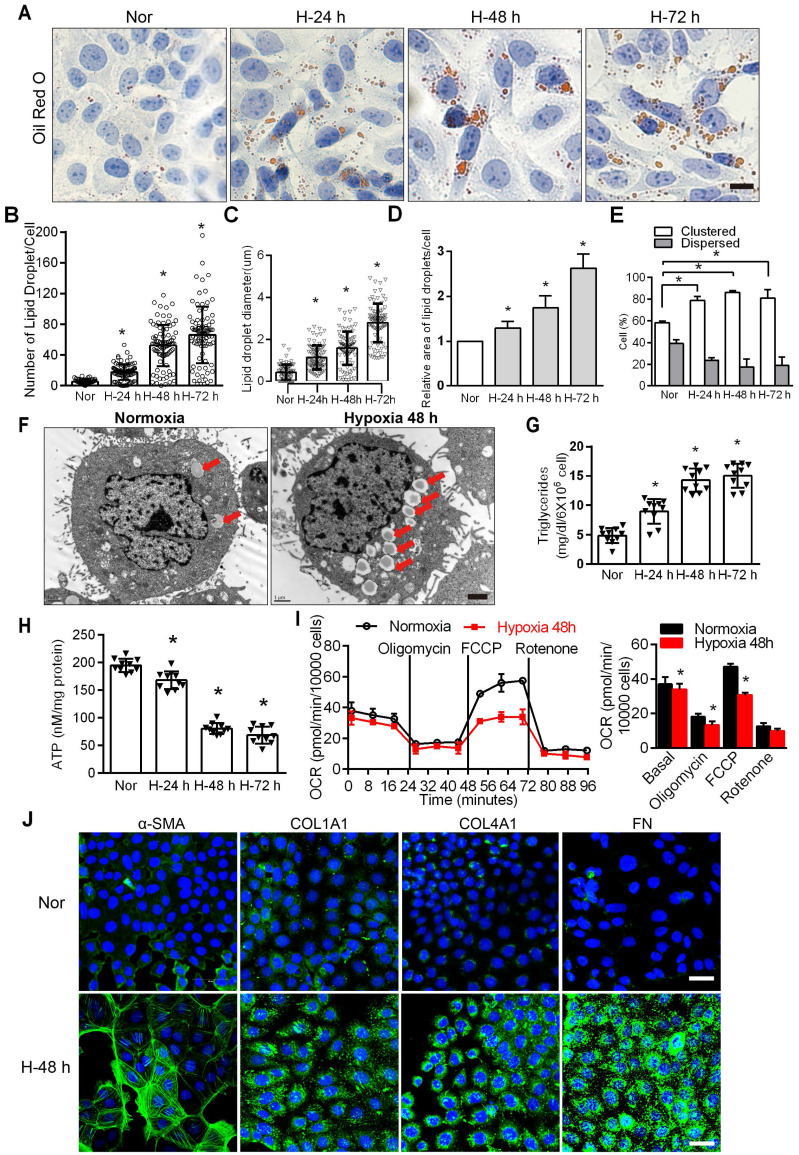
Figure 1.
Hypoxia-induced defective FAO and up-expression of fibrosis factors in PTCs. A. Lipid droplets were detected by ORO staining, Scale bar, 25 µm, and F electron microscope. Red arrows indicate lipid vacuoles. Bars = 2 µm. B. High-Content Screening Studio Cell Analysis Software analyzed the number of lipid droplets in the HK-2 cells treated with hypoxia and normoxia. C and D. The relative diameter and relative area of lipid droplets in cells were analyzed by Image J software. E. Scores indicate the distribution of lipid droplets (Dispersed or Clustered) in cells with different hypoxia time were analyzed by EVOS®FL Auto Cell Imaging System and Image J software. *P < 0.05 compared with the normoxic group. The patterns depicted densely clustered (Clustered) and fully dispersed (Dispersed) 26. Data are the average of 100-cell counts for each of three independent experiments. G. Detected triglyceride content of HK-2 cells extracted from normoxic (Nor) and hypoxia for 24 h (H-24 h), 48 h (H-48 h) and 72 h (H-72 h), respectively. *P < 0.05 compared with normoxic group. H. The content of ATP in HK-2 cells under normoxic (Nor) and hypoxia for 24 h (H-24 h), 48h (H-48 h) and 72 h (H-72 h) was detected. *P < 0.05 compared with the normoxic group. I. OCR in HK-2 cells exposed to hypoxia for 48 h or normoxia cells. Representative traces are shown on the left, and the summary data analyzed for 24 wells from 3 independent experiments are shown on the right. Where indicated, oligomycin (1 µM), FCCP (1 µmol/L) and rotenone (1 µmol/L) were added. J. Immunofluorescence analyses α-SMA, COL1A1, COL4A1 and FN (fibronectin) expression in HK-2 after 48 h of hypoxia (green), with DIPA (delta-interacting protein A) shown in blue. Scale bar, 10 µm. *P < 0.05 throughout the figure by unpaired Student's t test. All data throughout the figure are shown as the mean ± SEM. Each independent experiment was repeated three times.

