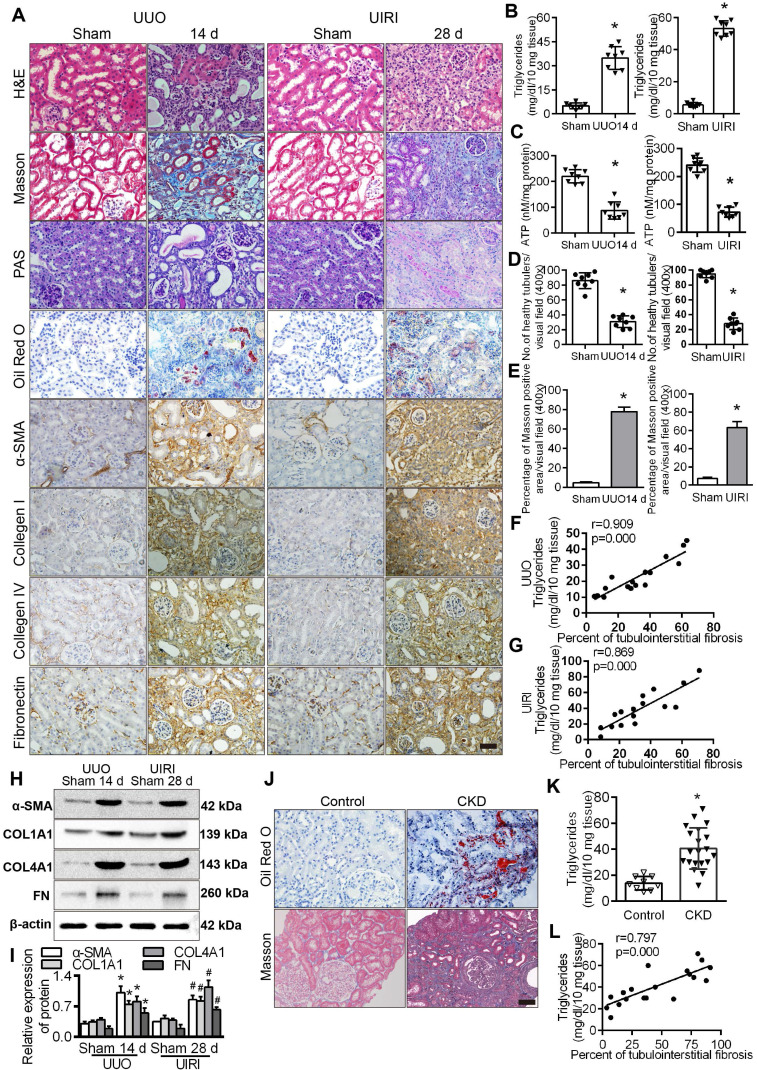
Figure 2.
Tubule epithelial FAO defects in CKD and mouse fibrosis models. A. The expression of α-SMA, COL1A1, COL4A1 and FN was detected in the kidneys of the sham-operated group, UUO after 14 days and UIRI after 28 days by Immunohistochemical (400×). Scale bar, 50 µm. n = 8, in each group. B. The triglyceride content in the renal tissues of the sham-operated group and the UUO and UIRI groups was detected by a triglyceride test kit. n = 8/group. C. Analysis of ATP in the kidney tissues of the sham, UUO and UIRI groups. n = 8/group. D. Number of healthy tubules, on the basis of H&E. n = 8/group. E. Tubulointerstitial fibrosis were evaluated by Masson's trichrome staining. n = 8/group. F and G. Analysis of the correlation between the degree of renal interstitial fibrosis and triglyceride in renal tissue of UUO and UIRI groups. n = 8/group. H and I. Levels of fibrosis factor α-SMA, COL1A1, COL4A1 and FN in the kidney tissues of the sham operation group, UUO group and UIRI group were detected by Western Blots. *P < 0.05 compared with the control group, n = 8/group for panels. J. Kidney tissue from patients with CKD (n = 20) and controls (n = 9) were stained with ORO and Masson (400×). Scale bar, 50 µm. K. Detected triglyceride in kidney samples from controls and patients with CKD. L. Analysis of the correlation between the degree of renal interstitial fibrosis and triglyceride in renal tissue of patients with CKD. *P < 0.05 compared with the control group.

