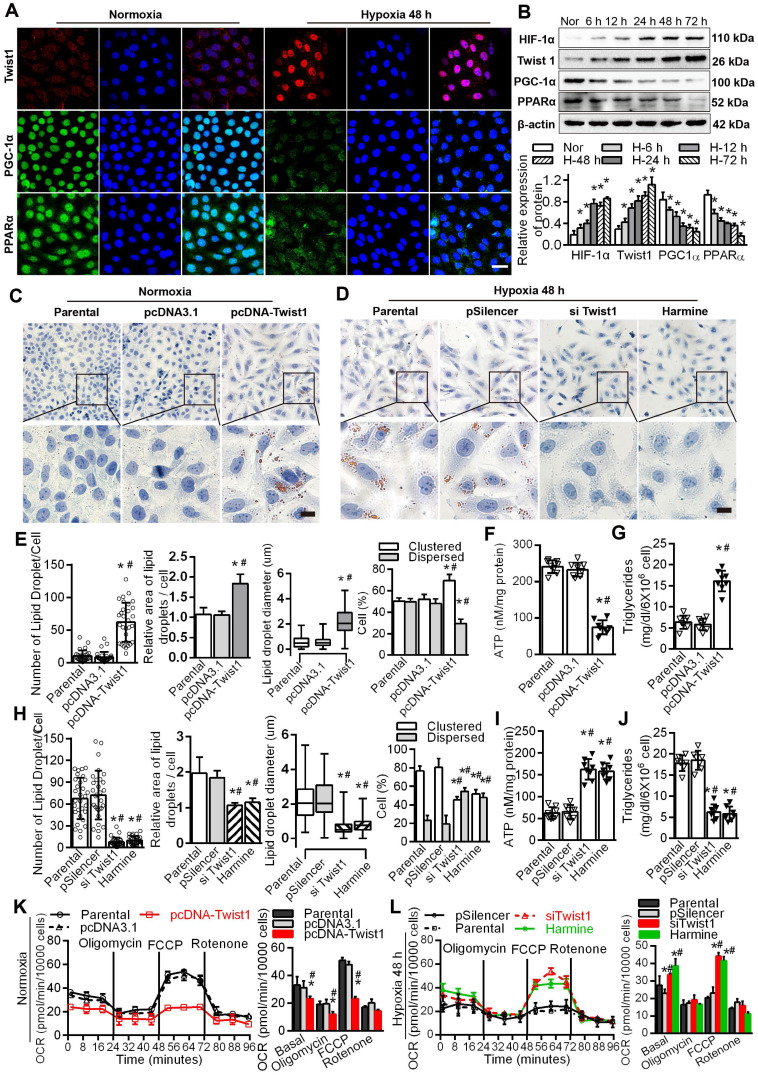
Figure 4.
Twist1 enhances lipid accumulation via derangement of the FAO pathway in PTCs. A. Immunofluorescence analyses of Twist1, PGC-1α and PPARα expressions in the HK-2 normoxia and after hypoxia 48 h (green) with DIPA (delta-interacting protein A) in blue. Scale bar, 10 µm. B. The expression of HIF-1α, Twist1, PGC-1α and PPARα in HK-2 cells under normoxia (Nor) and hypoxia for 6 h, 12 h, 24 h, 48 h and 72 h detected by Western Blot. *P < 0.05 compared with the normoxia. C and D. Lipid droplets were detected by ORO staining in HK-2 cell transfected with Twist1 overexpression plasmid pcDNA-Twist1 or control plasmid pcDNA3.1 and control (Parental). Scale bar, 25 µm. E and H. The number, relative area, diameter, clustering and dispersion patterns of lipid droplets in HK-2 cells transfected with pcDNA-Twist1, pcDNA3.1, siTwist1 or Harmine was detected by HCS Studio Cell Analysis Software. F and I. The ATP content of HK-2 transfected with pcDNA-Twist1, pcDNA3.1, siTwist1 or Harmine was detected. G and J. Triglyceride of HK-2 transfected with pcDNA-Twist1, pcDNA3.1, pSilencer, siTwist1 or Harmine was detected. *P < 0.05 compared with the parental, #P < 0.05, compared with the pcDNA3.1/pSilencer. K. OCR in HK-2 treated with pcDNA-Twist1 and pcDNA3.1 or not treated (parental). Representative traces are shown on the right, and summary data analyzed for 24 wells for three independent experiments are shown on the left. Where indicated, oligomycin (1 µM), FCCP (1 µmol/L) and rotenone (1 µmol/L) were added. L. OCR in HK-2 treated with siTwist1 or Harmine, as compared to parental or pSilencer. Representative traces are shown on the right, and summary data analyzed for 24 wells for three independent experiments are shown on the left. Where indicated, oligomycin (1 µM), FCCP (1 µmol/L) and rotenone (1 µmol/L) were added. *P < 0.05 compared with the parental, #P < 0.05, compared with the pcDNA3.1/pSilencer throughout the figure by unpaired Student's t test. Each data point represents the mean ± SEM of 3 independent samples.

