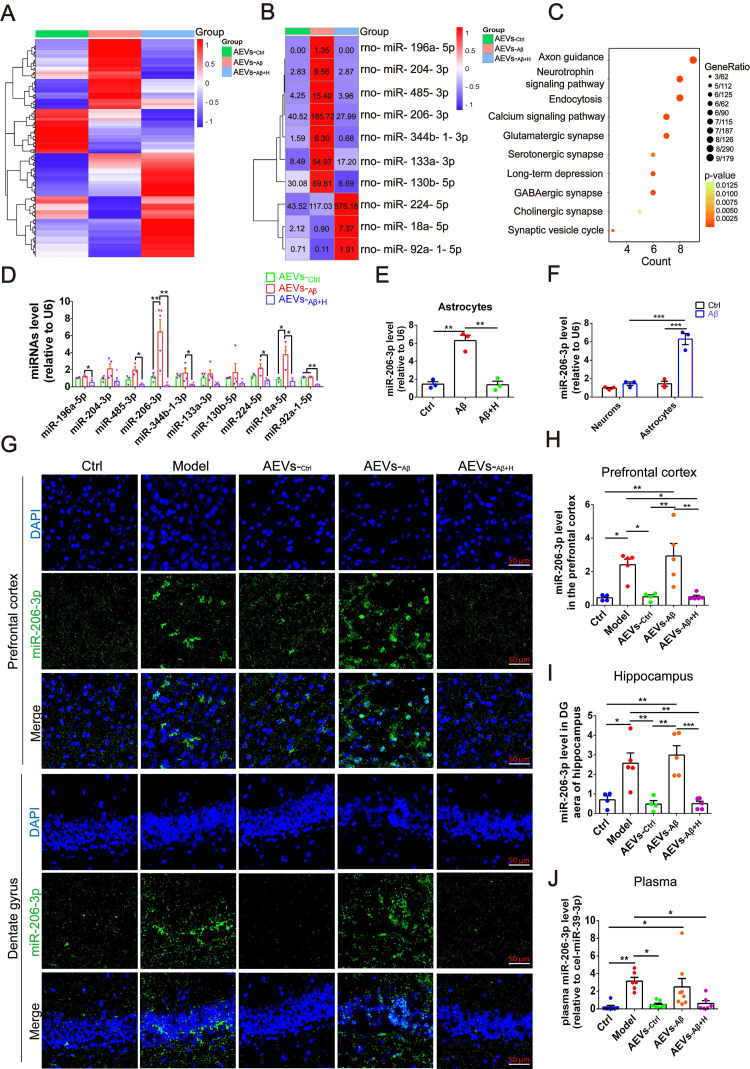
Figure 4.
aFGF down-regulates the level of miR-206-3p targeting BDNF in AEVs secreted in AD microenvironment. (A) Heatmap of miRNA expression profile showing the expression difference in AEVs-Ctrl, AEVs-Aβ and AEVs-Aβ+H by color bar. Red represents increased expression and blue represents decreased expression. Scale is 1.0 to -1.0. (B) Heatmap image displays the significant difference of miRNAs in AEVs-Ctrl, AEVs-Aβ and AEVs-Aβ+H, and the miRNA level is showed as number in each square. (C) Representative signaling pathways of genes targeted by significantly differential miRNAs according to KEGG analysis. (D) The differential miRNAs verified by qPCR in AEVs, n = 3-5. (E) The expression of miR-206-3p detected by qPCR in astrocytes damaged by Aβ accompanied with haFGF14-154 treatment, n = 3. (F) Comparison of miR-206-3p level between neurons and astrocytes subjected to Aβ1-42 oligomer, n = 3/4. (G) The distribution of miR-206-3p (green) in the PFC and hippocampal DG region of APP/PS1 mice measured by FISH and the quantified levels in the PFC (H) and DG region (I), n = 4/5. (J) The plasma miR-206-3p level detected by qPCR in wild-type mice and APP/PS1 mice with intranasal administration of AEVs or PBS, n = 6-8. Data are mean ± SEM. *p < 0.05, **p < 0.01, ***p < 0.001. P values are calculated by one-way ANOVA with Tukey's post-hoc test and two-way ANOVA with Tukey's post-hoc test.

