Figure 1.
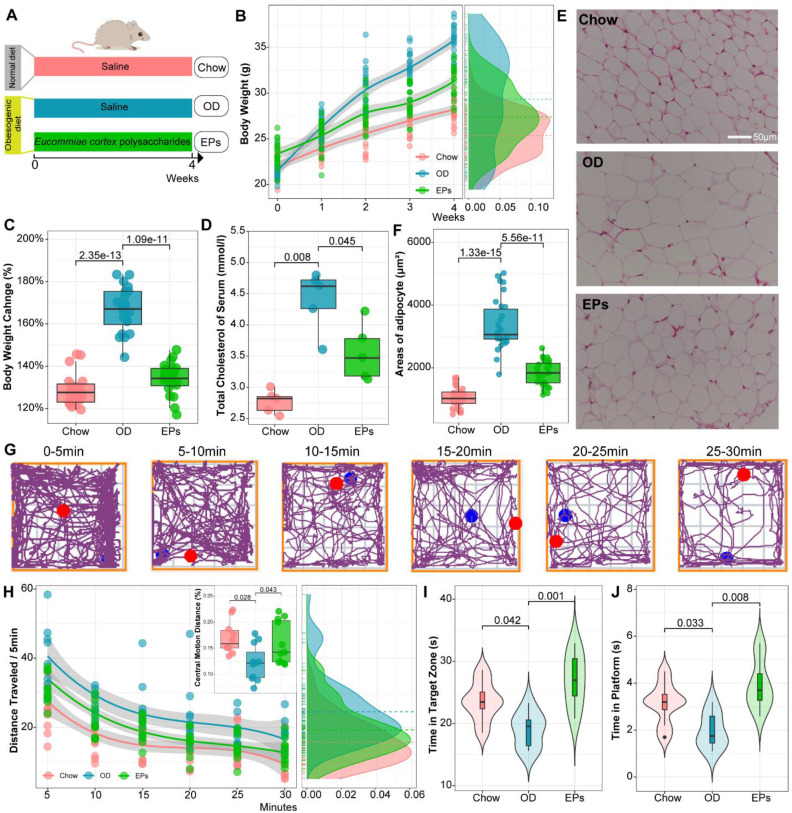
EPs mitigated OD-induced obesity-related symptoms and behavioral dysfunction. (A) The schematic diagram for time and administration in the experimental procedure. Mice were fed with the following diet respectively, Chow: normal diet, OD: a diet containing high sucrose and fat, EPs: a diet containing high sucrose and fat, but supplemented with EPs (n = 20 individuals/group). (B) Growth curve of body weight during experiment. (C) Quantitative analysis of weight change at the end of the experiment. Obesity traits, including total serum cholesterol (D) and adipocyte size (epididymal white adipose tissue) (E-F), were quantitatively analyzed. (G) Representative tracing of mice in open field test at each 5-min time interval of the 30-min. Chow n = 10, OD and EPs n = 11. (H) The average distance traveled (meters) was measured in 5-min time bins across a 30-min session in an open field box. (Inset) The ratio of central motion distance of mice in the entire box during 30-min. (I, J) Morris water maze test (n = 8 individuals/group). Compared to Chow, the mice fed with OD spent less time in the target zone and platform area, indicating the deficits of spatial learning and memory, which were rescued by EPs supplementation. In D, n = 5 individuals/group. In F, n = 30 slices from 6 mice. In B, smoothing curves based on the linear model are shown in gray with 95% confidence intervals. In C-D, F, and H-J, Chow and EPs were compared to OD by one-way ANOVA, adjusted for multiple comparisons by Dunnett's post-hoc. In H, repeated-measures ANOVA was used to assess the adaptation of mice to novel environments. Lines in boxes represent median, top and bottom of boxes represent first and third quartiles, and whiskers represent 1.5 interquartile range.

