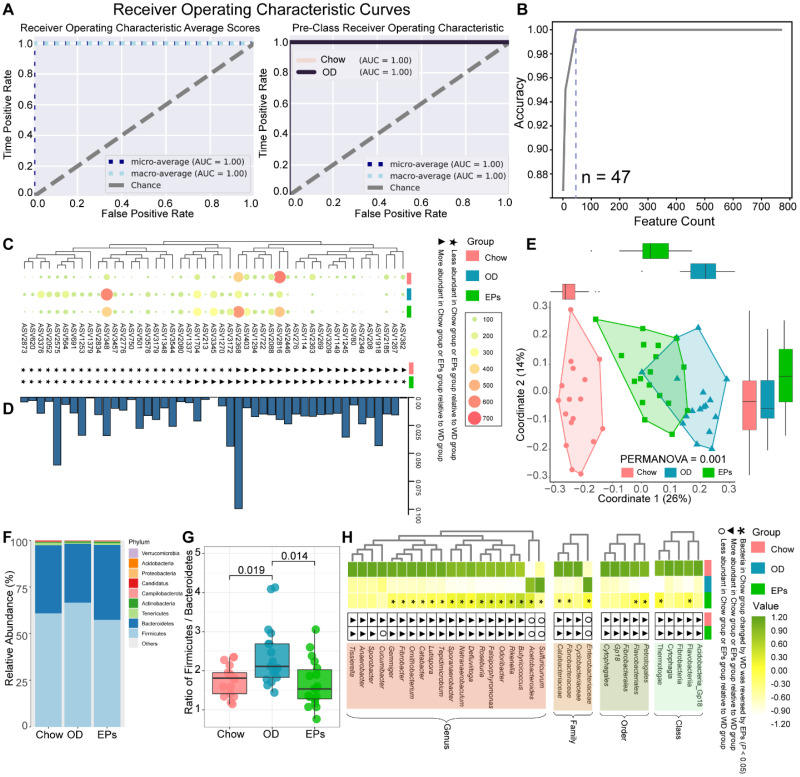
Figure 2.
EPs remodeled the gut microbiota in OD-fed mice. (A) Receiver operating characteristic curve is a graphical representation of the classification accuracy of a machine-learning model (Chow and OD n = 17, EPs n = 18). The 5-fold cross-validation method was adopted to train the classification model to identify the indicator taxa between the Chow and OD groups. The trained classification model accurately distinguished the type of gut fecal samples from their original groups. (B) 47 features were selected to construct a classification model. The abundance of ASVs selected to construct classification models was shown in C. (D) The importance of ASVs in C was calculated. (E) ASV-based PCoA with Bray-Curtis distance (for principal component1 and principal component2) showed the variations of gut microbial β-diversity of three groups and assessed by PERMANOVA. (F) Bacterial taxonomic profiling at the phylum level from different groups. (G) Firmicutes/Bacteroidetes ratio in the indicated groups. (H) Heatmap showed the abundance of taxa significantly influenced by OD compared with that in mice fed with normal diet. In G, statistical significance compared to OD by one-way ANOVA, adjusted for multiple comparisons by Dunnett's post-hoc. In H, Mann-Whitney U-test was used to identify the bacterial taxa affected by high fat and sucrose diet (Chow VS OD) and to assess the remodeling effect of polysaccharides on diet-disturbed bacteria (OD VS EPs). Lines in boxes represent median, top and bottom of boxes represent first and third quartiles, and whiskers represent 1.5 interquartile range. In L, smoothing curves based on the linear model are shown in gray with 95% confidence intervals.

