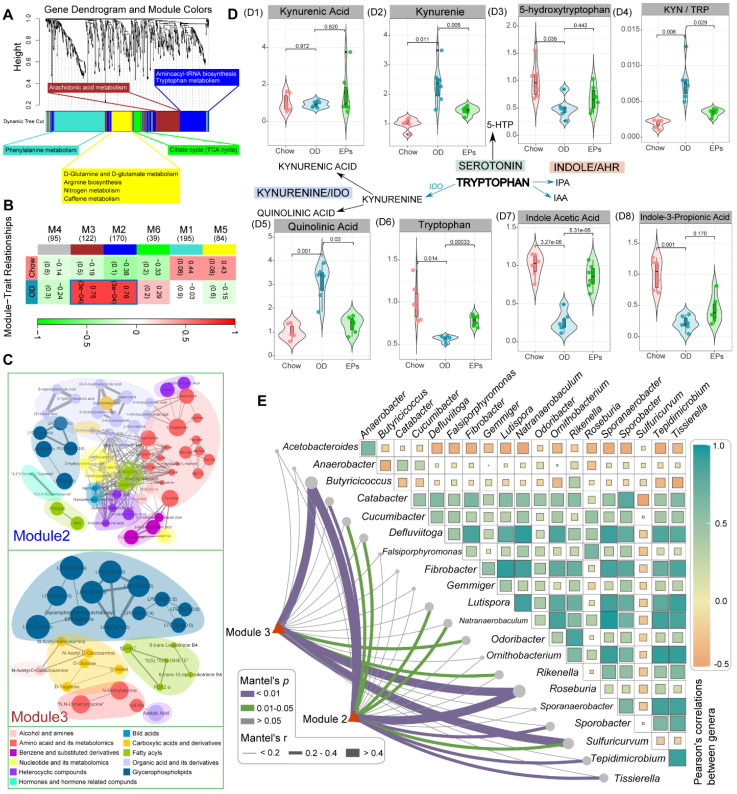
Figure 4.
EPs attenuated OD-induced metabolic disruption. (A) WGCNA cluster dendrogram groups metabolite into distinct metabolite modules (with different colors) defined by dendrogram branch cutting. The functional enrichment analysis of different modules was performed by MetaboAnalyst. (B) Association of metabolite WGCNA modules with group information. (C) Network diagrams of differential metabolites in two metabolic modules (M2, M3) that are significantly correlated to OD. Circle colors indicate the different class I metabolites category in each module; circle size indicates the abundance of the metabolites. Metabolites were mainly classified into three classes: amino acid and its metabolomics, organic acid and its derivatives, and glycerophospholipids. (D) These serum metabolites were mapped into the tryptophan metabolic pathway. The majority of metabolites in the kynurenine pathway were upregulated in OD group relative to Chow group (D1-2, D5). Meanwhile, serotonin (D3) and indole pathways (D7-8) were depleted in the OD group. (E) Pairwise comparisons of OD-altered genera are shown, with a color gradient denoting Pearson's correlation coefficients. OD-associated metabolite modules (M2, M3) were related to each genus by Mantel tests. Edge width corresponds to the Mantel's r statistic for the corresponding distance correlations, and edge color denotes the statistical significance based on 999 permutations. n = 6 individuals/group. Statistical significance compared to OD by one-way ANOVA, adjusted for multiple comparisons by Dunnett post-hoc. Lines in boxes represent median, top and bottom of boxes represent first and third quartiles, and whiskers represent 1.5 interquartile range.

