Figure 5.
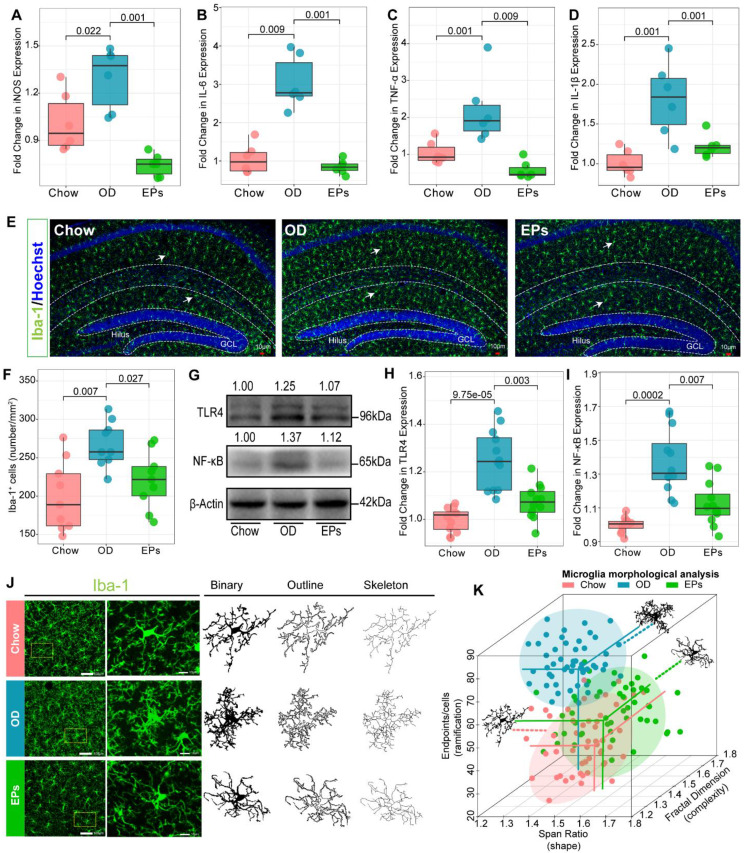
EPs inhibited OD-induced hippocampal neuroinflammation. Relative expression of iNOS (A), IL-6 (B), TNF-α (C), and IL-1β (D) in hippocampus tissues was assessed using qRT-PCR (n = 6 individuals/group). Compared to those in Chow, the above inflammatory and oxidative factors were significantly upregulated in OD, which was suppressed by supplementation of EPs. (E) Confocal photomicrographs of microglia (green) labeled with antibody against Iba1 in hippocampus. Nuclei were counterstained with Hoechst (blue). (F) Quantitative analysis of microglial density in the molecular layer of dentate gyrus (n = 9 slices from 3 mice). OD increased the density of microglia compared to that in Chow. However, supplementation of EPs decreased microglia density induced by OD. (G-I) The expression of TLR4 and NF-κB in hippocampus was examined by using western blot and quantitatively analyzed (n = 12 for each group). EPs supplementation decreased the expression of TLR4 and NF-κB in OD-fed mice. (J) Skeleton analysis of microglia morphologies in hippocampus. Original photomicrographs (green) were subjected to a series of uniform ImageJ plugin protocols prior to conversion to binary images; binary images (dark) were then skeletonized. All skeleton analysis was completed on full-sized photomicrographs. (K) Diverse microglia morphologies across three groups (n = 50 cells from 3 mice). In OD-fed mice, the microglia showed more and shorter branches than in Chow. The morphology of microglia in EPs was closer to that in Chow. Statistical significance compared to OD group by one-way ANOVA, adjusted for multiple comparisons by Dunnett post-hoc test. Lines in boxes represent median, top and bottom of boxes represent first and third quartiles, and whiskers represent 1.5 interquartile range.

