Figure 7.
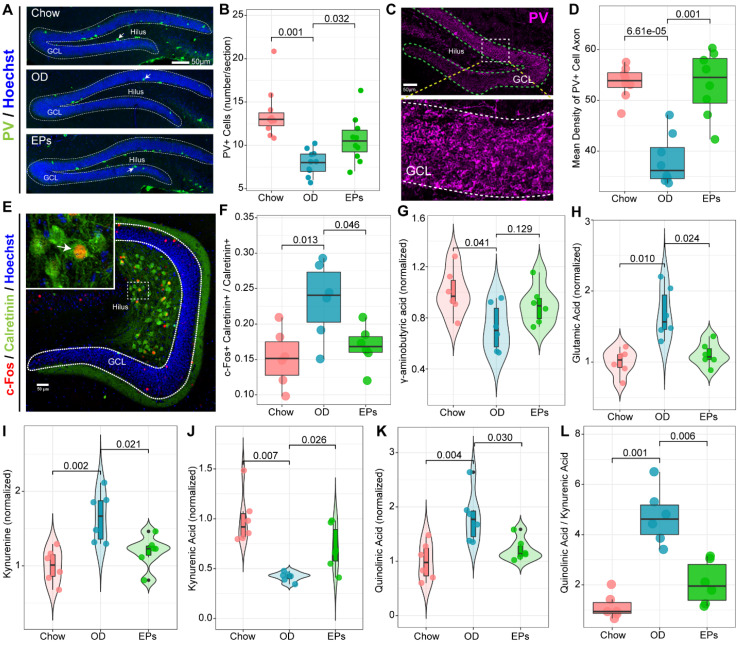
EPs inhibited the Kyn pathway and rebalanced GABA and glutamate acid in the hippocampus of OD-fed mice. (A) Confocal images of dentate gyrus with immunohistochemistry for Parvalbumin (PV), a specific marker for one subset of GABAergic interneurons. Nuclei were counterstained with Hoechst (blue). The somata of a majority of PV-positive interneurons (green) were located in the SGZ of DG. (B) Quantification showed that compared to that in DG of Chow, the number of PV-positive interneurons in DG of OD significantly decreased, which was prevented by supplementation of EPs. n = 9 slices from 3 mice. (C) Representative high magnification image of PV-positive axonal projection in granule cell layer of DG. (D) Quantitative analysis showed that EPs prevented the DG from reducing PV-positive axonal projections in granule cell layer induced by OD. n = 9 slices from 3 mice. (E) Representative confocal image of double immunohistochemistry with antibodies against c-Fos (red) and Calretinin (green), a marker of mossy cells in DG. The nuclei (blue) of many Calretinin-positive mossy cells were co-labeled with c-Fos, indicating the activation of mossy cells. (F) Quantification of mossy cells double-labeled with c-Fos and Calretinin in the DG showed that OD induced the overactivation of mossy cells compared to Chow, which was rescued by supplementation of EPs (n = 6 slices from 3 mice). Gas chromatography-mass spectrometry was used to assess the concentration of GABA (G), glutamic acid (H), kynurenine (I), kynurenic acid (J), quinolinic acid (K), and the ratio of quinolinic acid/kynurenic acid (L) in the hippocampus (n = 6 individuals/group). Compared to Chow, OD significantly reduced the inhibitory neurotransmitter GABA, whereas the excitatory neurotransmitter glutamate increased, resulting in an imbalance of inhibition and excitation of hippocampal circuits. Supplementation of EPs mitigated this imbalance. Statistical significance compared to OD group by one-way ANOVA, adjusted for multiple comparisons by Dunnett post-hoc test. Lines in boxes represent median, top and bottom of boxes represent first and third quartiles, and whiskers represent 1.5 interquartile range.

