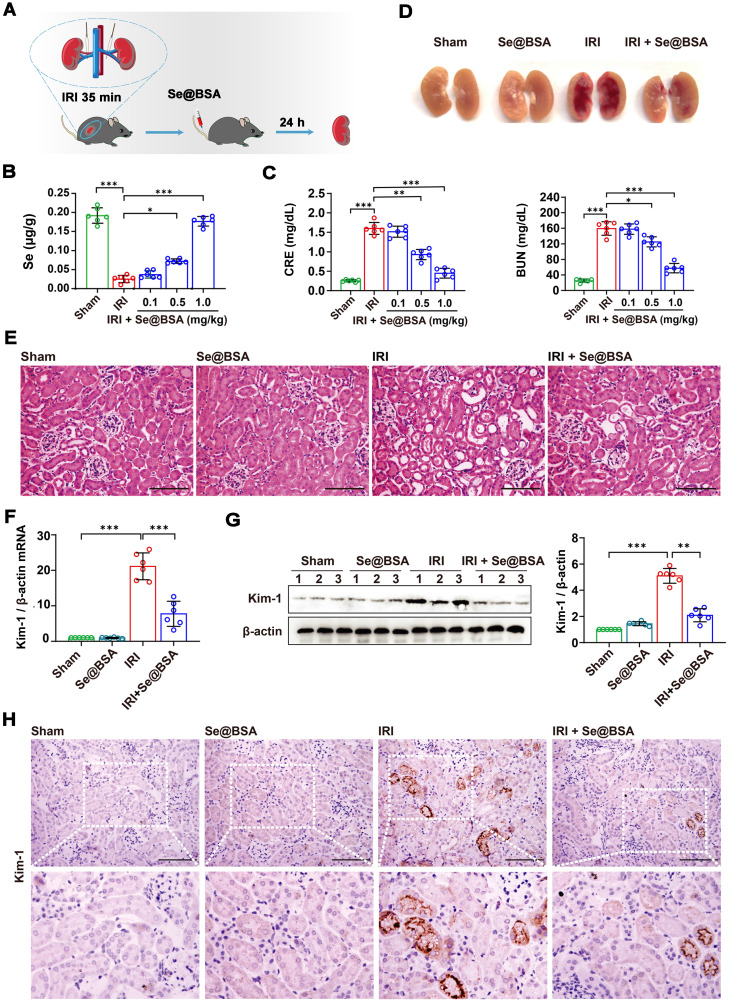
Figure 3.
(A) Diagram depicting the establishment of the IRI-AKI mouse model. (B) Se contents in the kidneys of IRI-AKI mice. The results are shown as the mean ± SD. *, P < 0.05; ***, P < 0.001. (C) CRE and BUN contents in IRI-AKI mice after Se@BSA NP treatment. The results are shown as the mean ± SD. *, P < 0.05; **, P < 0.01; ***, P < 0.001. (D) Pictures of mouse kidneys. (E) HE staining of the kidneys of IRI-AKI mice treated with Se@BSA NPs. The scale bar indicates 200 µm. (F) Kim-1 mRNA expression relative to β-actin expression in mouse kidneys. The results are shown as the mean ± SD. ***, P < 0.001. (G) Western blotting detecting the Kim-1 expression in the kidneys. β-actin was used as the reference. Histogram shows the results of gray analysis for the protein bands. The results are shown as the mean ± SD. **, P < 0.01; ***, P < 0.001. (H) Immunohistochemical staining showing the Kim-1 expression in the kidneys. The scale bar indicates 200 µm.

