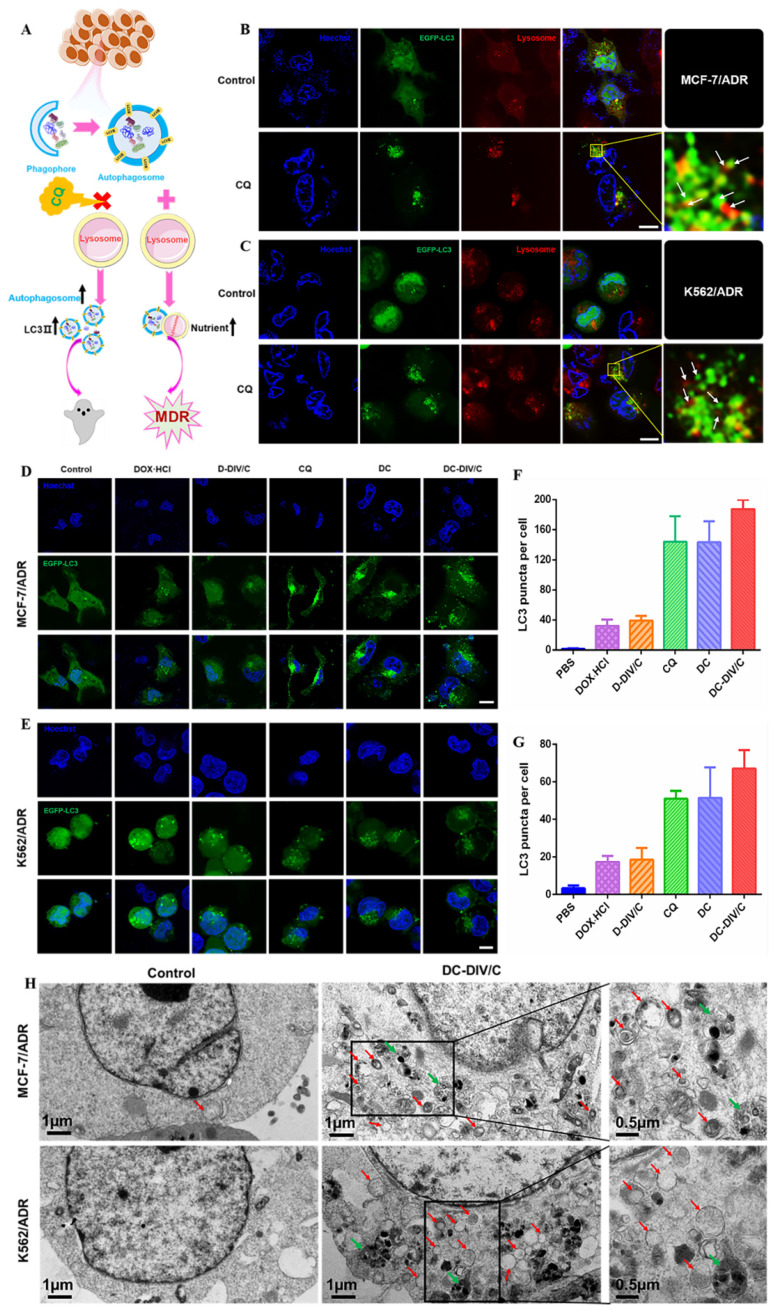
Figure 4.
Intracellular autophagic level and autophagic flux analysis. (A) A simple schematic diagram on the role of autophagy inhibition with CQ against drug resistant cells. (B-C) EGFP-LC3 transfected MCF-7/ADR (B) and K562/ADR (C) cells were treated with 10 µg/ml CQ for 24 h, the lysosome detected with Lyso-Tracker Red probes. (D-E) Representative images of EGFP-LC3 transfected MCF-7/ADR (D) and K562/ADR cells (E). The EGFP-LC3 transfected cells were treated with various groups for 24 h and the concentration of DOX·HCl and CQ in these various groups were 5 µg/ml and 10 µg/ml, respectively. (F-G) Quantification of EGFP-LC3 puncta in MCF-7/ADR (F) and K562/ADR (G) cells. All scale bars: 10 µm. (H) TEM images of MCF-7/ADR cells and K562/ADR cells treated with PBS and DC-DIV/C for 48 h (red arrows indicate autophagosomes; green arrows indicate autolysosomes). Data are shown as the mean ± SD.

