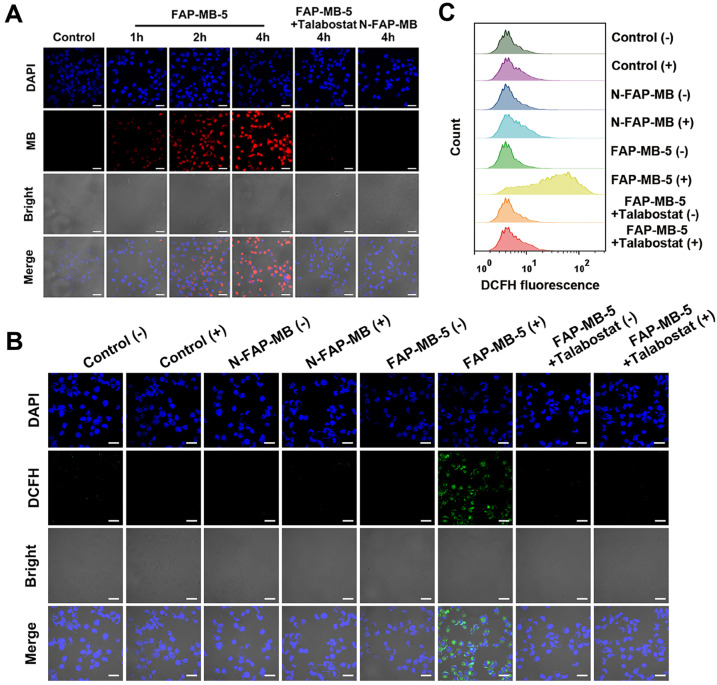
Figure 3.
(A) CLSM images of Mia-paca-2 cells incubated with FAP-MB-5 (40 μg/mL) for 1 h, 2 h and 4 h. As inhibition group, the cells were pre-incubated with talabostat (50 μM) for 1 h, and then incubated FAP-MB-5 for 4 h. The blue fluorescence represents the cell nuclei stained with DAPI (excitation: 405 nm) and the red fluorescence represents MB liberated from FAP-MB-5 (excitation: 633 nm). Scale bar: 30 μm. Intracellular ROS generation of Mia-paca-2 cell treated with FAP-MB-5 (40 μg/mL) or N-FAP-MB (40 μg/mL) under dark or irradiation condition observed by CLSM (B) and flow cytometry analysis (C). The inhibition group was pre-incubated with talabostat for 1 h and treated with FAP-MB-5 with irradiation. Scale bar: 30 μm. (+) and (-) refer to the treatment with or without irradiation, respectively.

