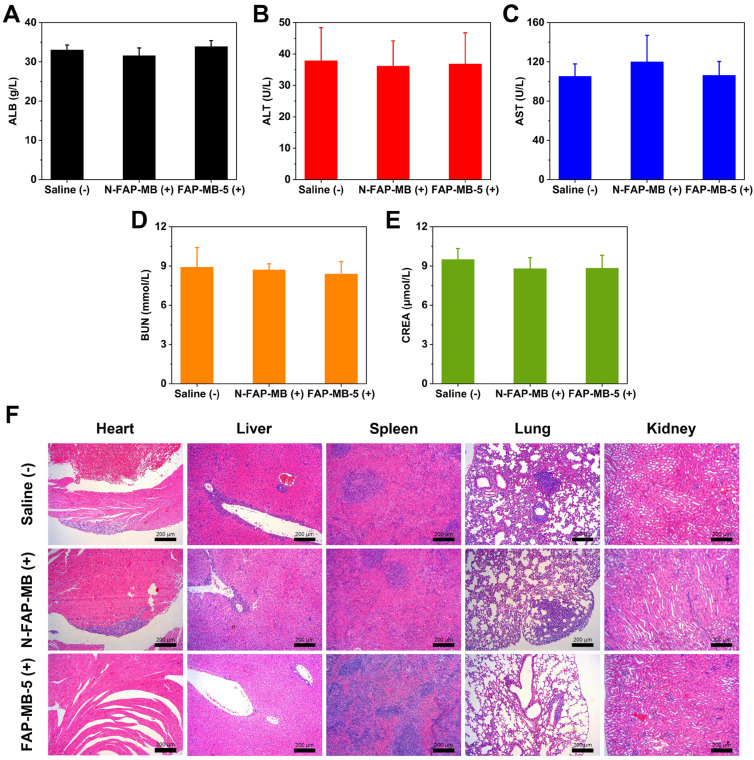
Figure 7.
Serum biochemistry analysis ALB (A), ALT (B), AST (C), BUN (D), CREA (E) of different groups after the 18-day treatment. (F) The H&E staining of major organs slices in various groups on 18th day. Scale bar: 200 μm. (+) and (-) refer to the treatment with or without NIR irradiation, respectively. Results are described as mean ± SD, n = 6.

