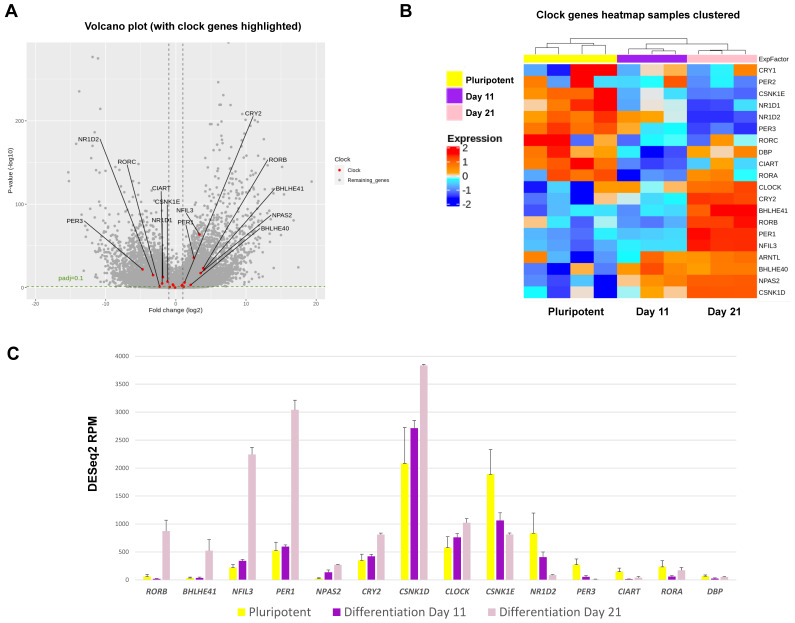
Figure 7.
Expression changes for circadian clock genes as revealed by RNAseq during RAPID chondrogenic differentiation of MAN13 cells. (A). Volcano plot of differential expression analysis results for all genes whose expression levels followed the chondrogenic developmental stages. Data were plotted against -Log10 p-value. Horizontal dotted lines represent significance level of padj < 0.1. Vertical dotted lines indicate Log2 fold change of -1 and 1 between Day 21 vs. Day 11. Significant clock genes with padj < 0.1 and log2FC > 1 or < -1 were highlighted in red with gene names. (B). Heatmap of the clock genes that showed significant variations among the three time points, as revealed by differential expression analysis. (C). RNAseq data (DESeq2 normalised counts) for clock genes that showed most significant variations among the three time points (padj < 0.01 and padj < 0.05 between Day 21 vs. Day 11). Mean ± SE, N = 3-4. Between Day 21 and Day 11: padj < 0.05 for CSNK1E, CLOCK and DBP; padj < 0.01 for NPAS2 and CIART; padj < 0.001 for all the other genes.

