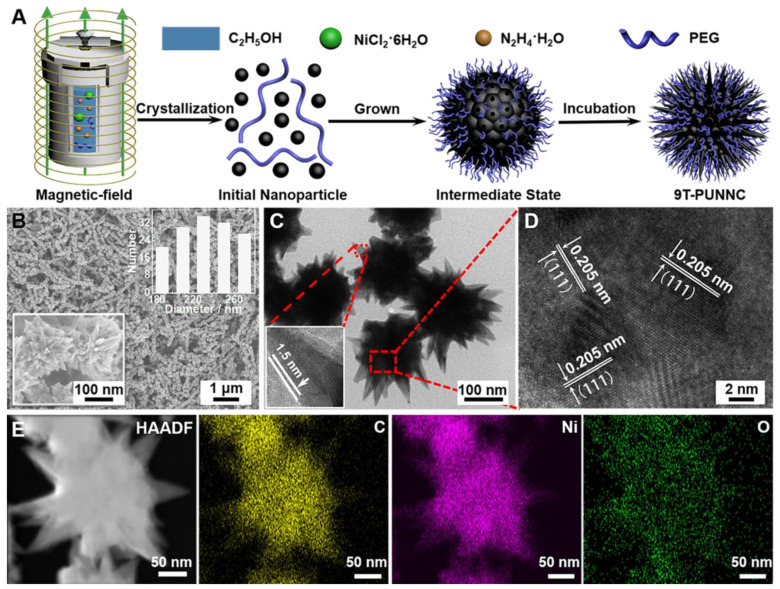
Figure 2.
Formation and structure of the 9T-PUNNC. (A) Schematic diagram of the synthesis. (B) SEM images (inset, left bottom) and size distribution (inset, top right). (C) TEM image and high-magnification images of a single needle (inset). (D) HRTEM image. (E) HAADF and corresponding element mappings (for C, O and Ni). Scale bar, 50 nm.

