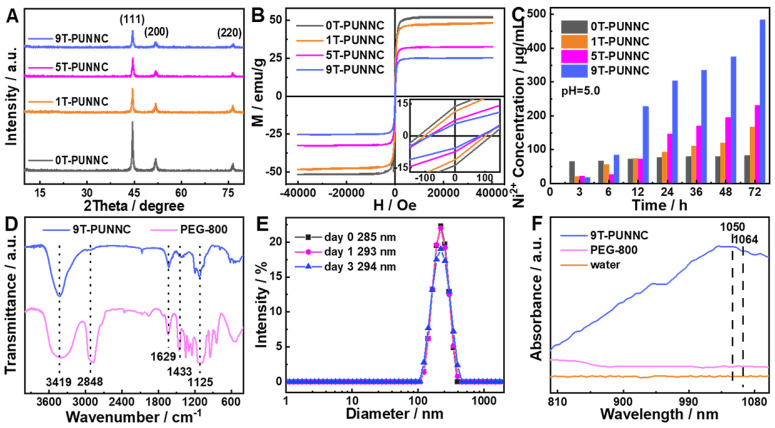
Figure 3.
(A, B and C) XRD patterns, hysteresis loops and dissolved rate of the PUNNCs synthesized under different magnetic field strengths. The inset in b is the expanded plot measured at room temperature. (D) FT-IR spectra of the as-synthesized 9T-PUNNC and PEG. (E) Hydrodynamic sizes of the 9T-PUNNC within 3 days. (F) UV-vis-NIR absorption of the 9T-PUNNC, PEG and pure water.

