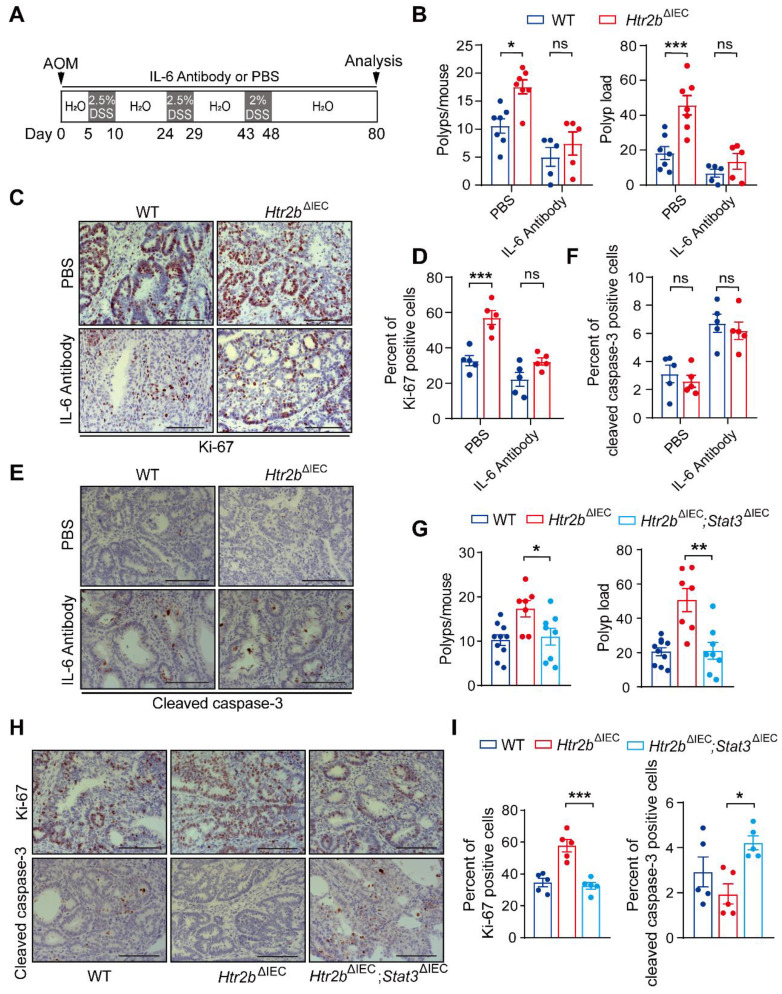
Figure 4.
Inhibition of IL-6 alleviates CAC in Htr2bΔIEC mice. (A) A schematic overview of the AOM/DSS model of CAC with IL-6 antibody or PBS treatment in mice. (B) The colonic polyp multiplicity and polyp load of AOM/DSS-treated WT and Htr2bΔIEC mice (n = 5-7) with IL-6 antibody or PBS treatment. (C) Immunohistochemical analysis of Ki-67 in colonic polyp tissues from WT and Htr2bΔIEC mice treated with PBS or IL-6 antibody. (D) The percentage of Ki-67 positive cells in colonic polyp tissues of WT and Htr2bΔIEC mice treated with PBS or IL-6 antibody (n = 5). (E) Immunohistochemical staining for cleaved caspase-3 in colonic polyp tissues of WT and Htr2bΔIEC mice treated with PBS or an IL-6 antibody. (F) The percentage of cleaved caspase-3 positive cells in colonic polyp tissues of WT and Htr2bΔIEC mice treated with PBS or an IL-6 antibody (n = 5). (G) The colonic polyp multiplicity and polyp load in WT, Htr2bΔIEC and Htr2bΔIEC; Stat3ΔIEC (double-knockout of Stat3 and Htr2b genes) mice treated with AOM and DSS (n = 7-10). (H) Immunohistochemical analysis of Ki-67 and cleaved caspase-3 in colonic polyp tissues of WT, Htr2bΔIEC and Htr2bΔIEC; Stat3ΔIEC mice treated with AOM and DSS. (I) The percentage of Ki-67 positive cells in the colonic epithelium of WT, Htr2bΔIEC and Htr2bΔIEC; Stat3ΔIEC mice (n = 5) treated with AOM and DSS. Scale bars, 100 μm. Error bars represent the mean ± SEM. ns: not significant, *P < 0.05, **P < 0.01, ***P < 0.001; Two-way ANOVA (B, D, F) and One-way ANOVA (G, I).

