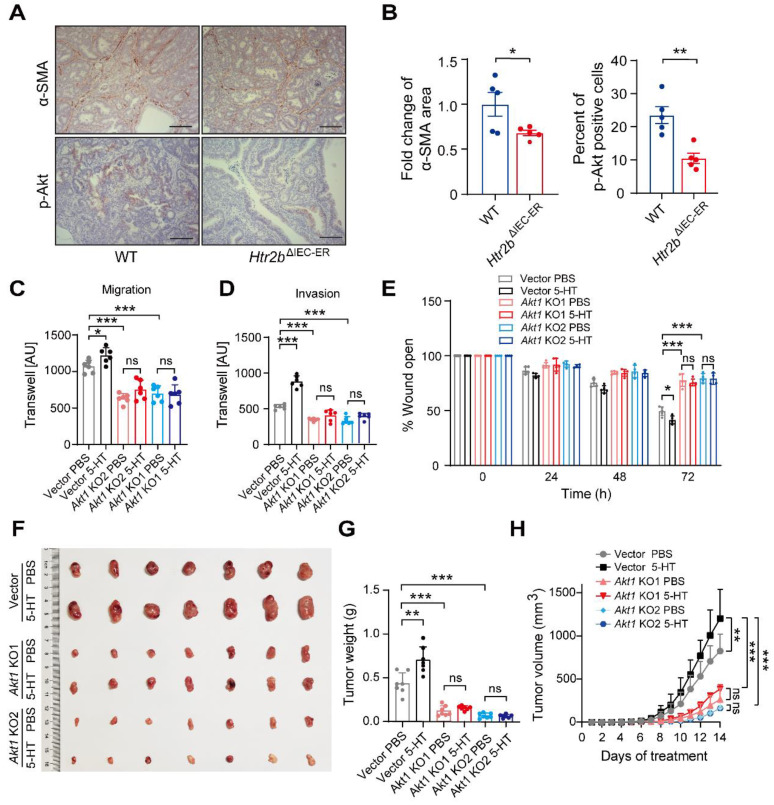
Figure 6.
Knocking out Akt1 attenuates 5-HT-induced migration and invasion of tumor cells. (A) Immunohistochemical analysis of p-Akt and α-SMA in the colonic polyp tissues of WT and Htr2bΔIEC-ER mice given AOM/DSS treatment. (B) Quantification of α-SMA positive area in colonic polyp tissues of WT and Htr2bΔIEC-ER mice (left). The percentage of p-Akt-positive cells in colonic polyp tissues of WT and Htr2bΔIEC-ER mice (n = 5) (right). (C-D) Transwell assay results for the migration (C) and invasion (D) of vector, Akt1 KO1, and Akt1 KO2 monoclonal cell lines treated with 5 μM 5-HT or PBS (n = 6). AU: arbitrary unit. (E) Wound healing results for the migration of vector, Akt1 KO1, and Akt1 KO2 monoclonal cell lines treated with 5 μM 5-HT or PBS (n = 5). (F-H) Representative images (F), tumor weight (G), and tumor volumetric time curve (H) of vector, Akt1 KO1, Akt1 KO2 allograft tumors seeded in nude mice treated with PBS or 5-HT (n = 7). Scale bars, 100 μm. Error bars represent the mean ± SEM. ns: not significant, *P < 0.05, **P < 0.01, ***P < 0.001; unpaired Student's t-test (B), One-way ANOVA (C-E, G), and Two-way ANOVA (H).

