Figure 1.
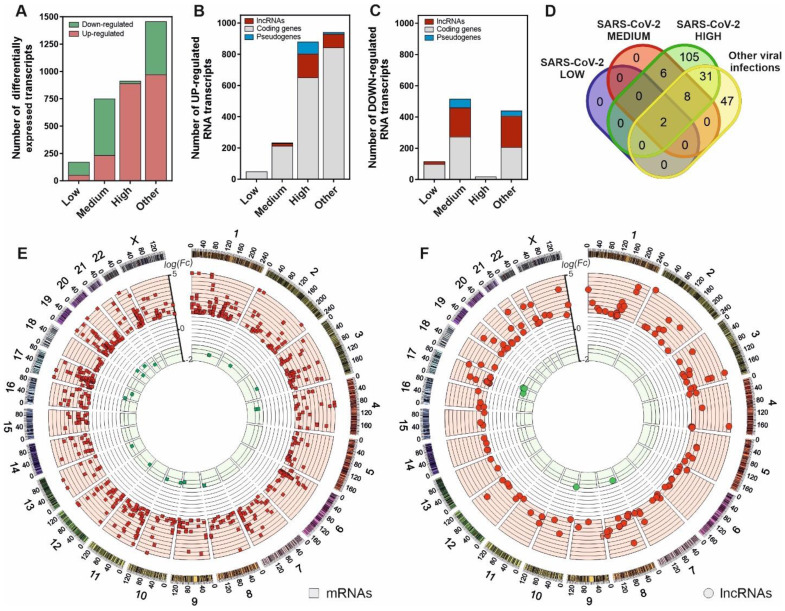
SARS-CoV-2 infection is characterized by a gene expression pattern enriched in up-regulated mRNA and lncRNA transcripts that can be correlated with the viral load observed in patients. A, number of differentially expressed transcripts observed in patients with different SARS-CoV-2 viral loads (Low, Medium and High) and those infected with different respiratory viruses (Other) in comparison with the uninfected patients; B, number of the different families of up-regulated transcripts in SARS-CoV-2 patients and infected with other respiratory viruses in comparison with the control group; C, number of the different families of down-regulated transcripts in SARS-CoV-2 patients and infected with other respiratory viruses in comparison with the control group; D, Venn diagram representing the number of up-regulated lncRNA transcripts observed in each group of study referred to the uninfected control group; E, CIRCOS plot 45 showing the genomic location and fold changes of the differentially expressed coding transcripts in the group of SARS-CoV-2 patients infected with higher viral loads in comparison with the uninfected controls (red squares, up-regulated mRNAs; green squares, down-regulated mRNAs); F, CIRCOS plot 45 depicting the genomic locations and fold changes of the differentially expressed lncRNA transcripts in the group of SARS-CoV-2 patients infected with higher viral loads in comparison with the uninfected controls (red circles, up-regulated lncRNAs; green circles, down-regulated lncRNAs).

