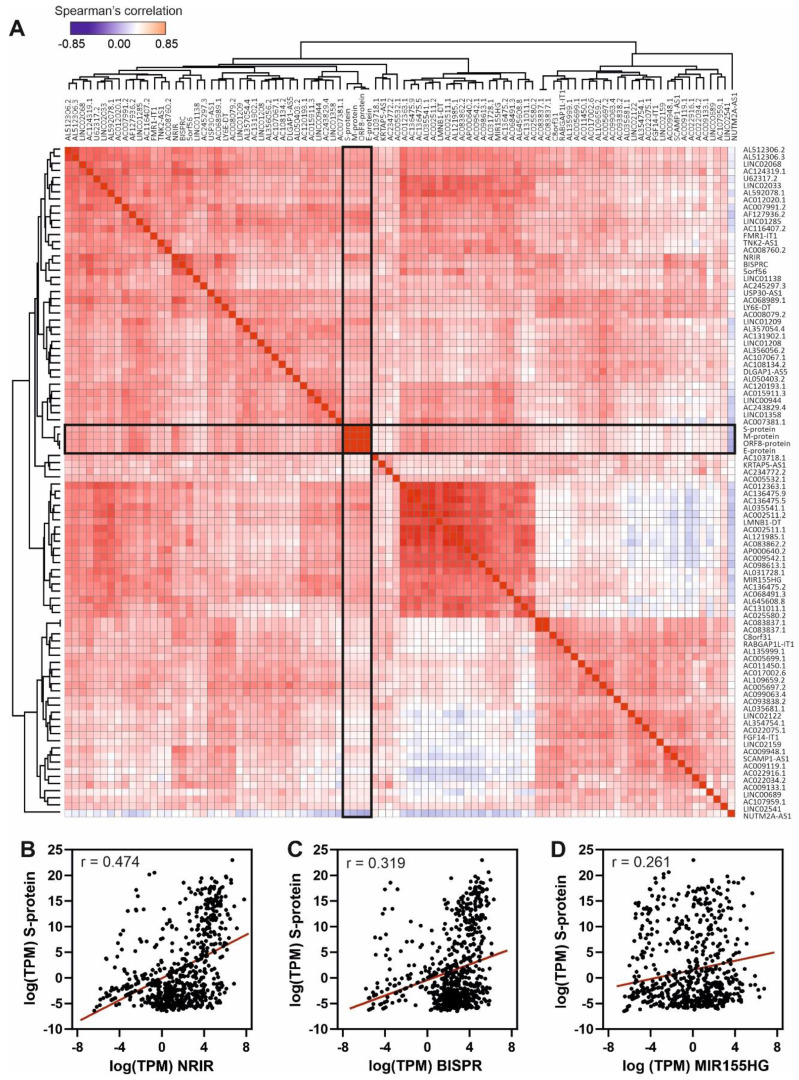
Figure 4.
Spearman's correlation analysis of the top 90 upregulated lncRNAs and the viral gene transcripts in the cohort of analyzed samples. A, Hierarchical clustered Spearman's correlation matrix for the overexpressed lncRNAs and the detected SARS-CoV-2 transcripts across all the samples analyzed by the BioCPR software 75. The SARS-CoV-2 mRNA transcripts are highlighted within boxes; B, correlation analysis between NRIR lncRNA and S-protein transcript; C, correlation analysis between BISPR lncRNA and S-protein transcript; and D, correlation analysis between MIR155HG lncRNA and S-protein transcript. The correlation coefficients showed in panels b, c and d correspond to the Spearman analysis and are significant in all cases with p-values < 0.0001.

