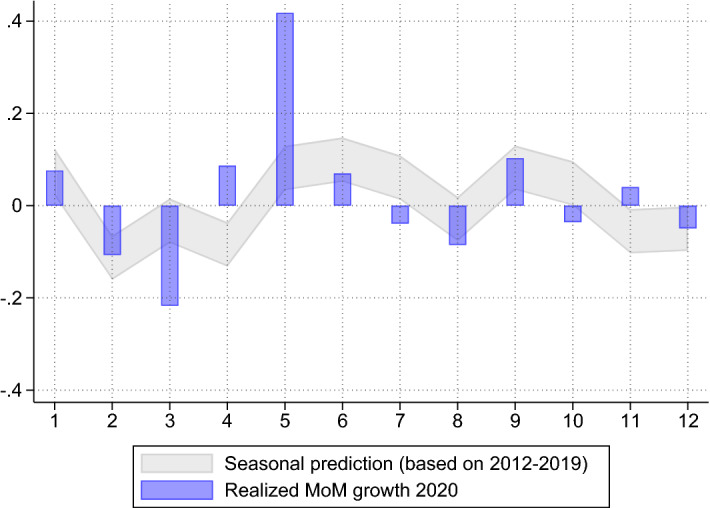
Fig. A.4.

Actual versus predicted monthly growth of Chinese imports. Source: French customs, import files. The figure shows the monthly growth of imports from China in 2020 (blue bars) and the mean monthly growth estimated based on data over 2012–2019
