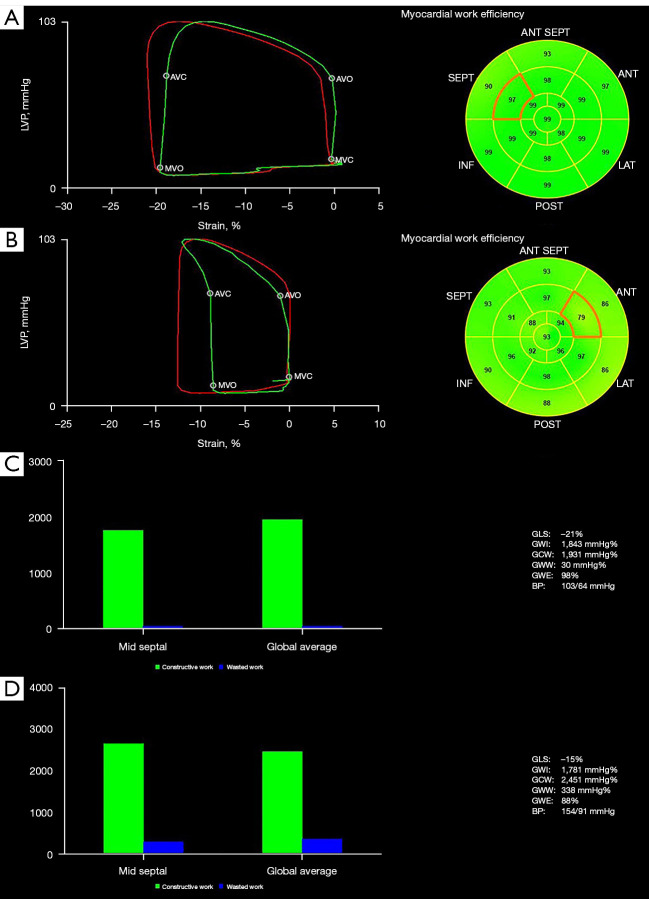
Figure 1.
LV myocardial work of control and SLE. (A,C) Control. (B,D) SLE. For (A) and (B), the left side shows the PSLs and their area represents the work index (red ring refers to global; green refers to a segment); the right side is the bullseye plot of 17 segments, which shows the global work efficiency (GWE). For (C) and (D), the left side represents the constructive work (GCW, green column) and wasted work (GWW, blue column) of the mid-septal and the global, respectively; the right side shows the specific values of the parameters. Note the LV myocardium was damaged in SLE. LVP, left ventricular pressure; ANT, anterior; SEPT, septal; INF, inferior; LAT, lateral; POST, posterior; BP, blood pressure; LV, left ventricular; SLE, systemic lupus erythematosus; PSL, pressure-strain loop; GLS, global longitudinal strain; GWI, global work index; GWE, global work efficiency; GCW, global constructive work; GWW, global wasted work.

