Figure 12.

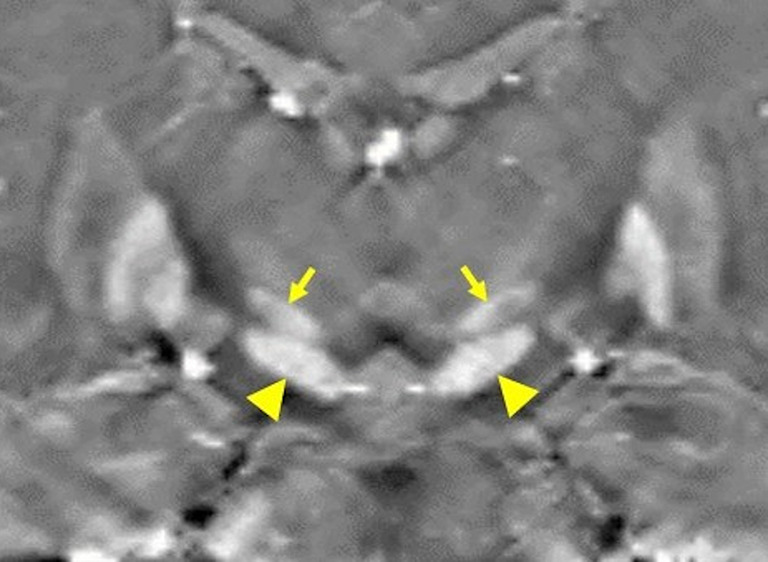
A coronal QSM image of the midbrain (0.5 mm isotropic resolution). The subthalamic nucleus (arrows) can be easily separated from the substantia nigra (arrowheads). QSM, quantitative susceptibility mapping.

A coronal QSM image of the midbrain (0.5 mm isotropic resolution). The subthalamic nucleus (arrows) can be easily separated from the substantia nigra (arrowheads). QSM, quantitative susceptibility mapping.