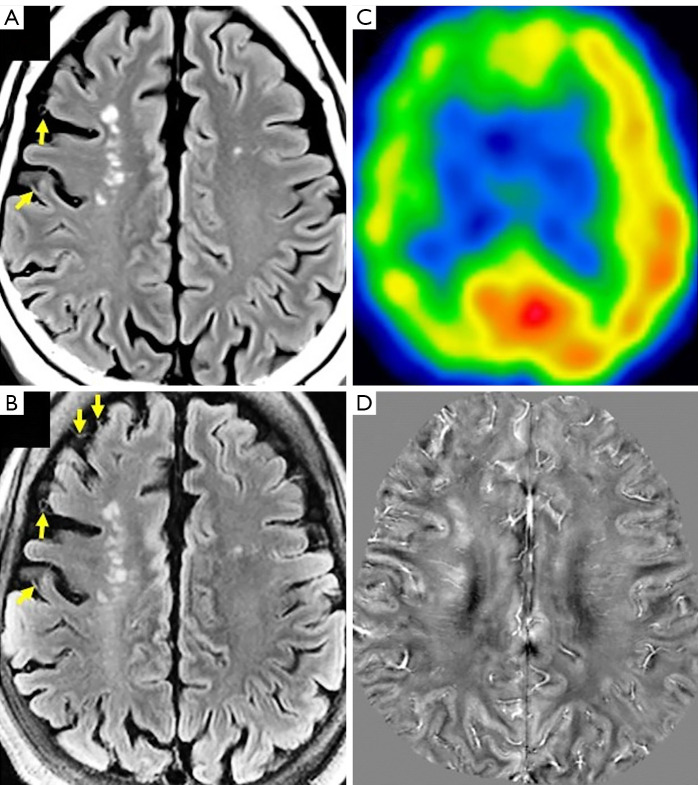
Figure 15.
The same patient as in Figure 12. FLAIR images acquired at 3T (A) and 7T (B). Both images show similar white-matter lesions as hyperintense, but “ivy-signs”, representing slow collateral flow, are better depicted at 7T (arrows). (C) CBF measured using iodine-123 N-isopropyl-p-iodoamphetamine SPECT at rest. CBF is widely lower on the right frontal area. (D) QSM acquired at 7T (0.5 mm isotropic resolution) shows increased susceptibility at the cortex, medullary veins, and ischemic lesions in the same area. The right side of the images shows the left side of the patient. CBF, cerebral blood flow; FLAIR, fluid-attenuated inversion recovery; 3T, 3 Tesla; 7T, 7 Tesla; SPECT, single-photon emission computed tomography; QSM, quantitative susceptibility mapping.

