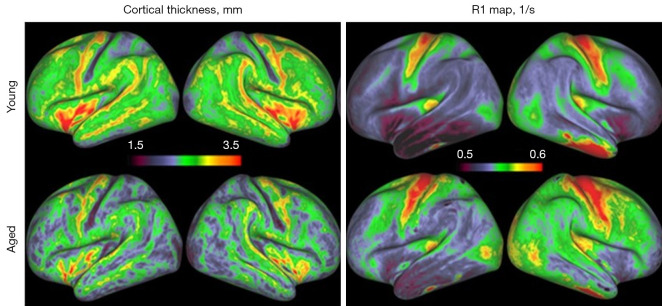
Figure 3.
Age-related changes in cortical thickness (mm) and R1 values (1/s) measured using MP2RAGE with 0.7-mm isotropic resolution. Surface maps show the average of 22 young (20–30 years old) and 8 aged (>60 years old) subjects. Decreases in cortical thickness and increases in R1 values are observed by aging. MP2RAGE, magnetization-prepared 2 rapid gradient echoes.

