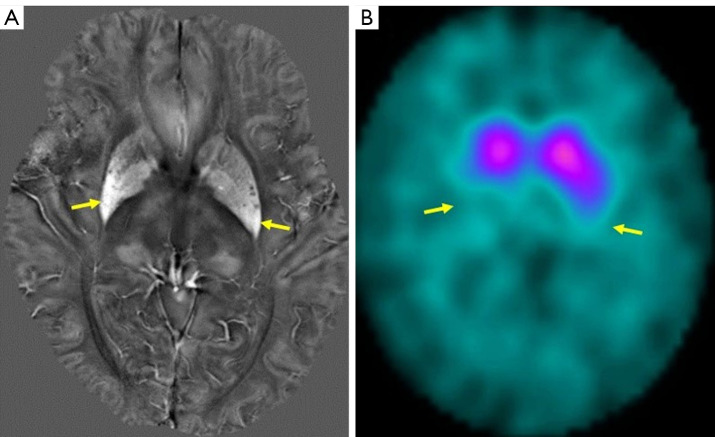
Figure 8.
A patient with MSA-P. (A) QSM at 7T shows increased susceptibility at the dorsolateral part of the putamen, particularly on the right side (arrows). (B) Dopamine transporter SPECT imaging shows a reduced specific binding ratio more prominently on the right, indicating a negative correlation between the 2 measurements (arrows). SPECT, single-photon emission computed tomography; QSM, quantitative susceptibility mapping; MSA-P, multiple system atrophy-parkinsonian type; 7T, 7 Tesla.

