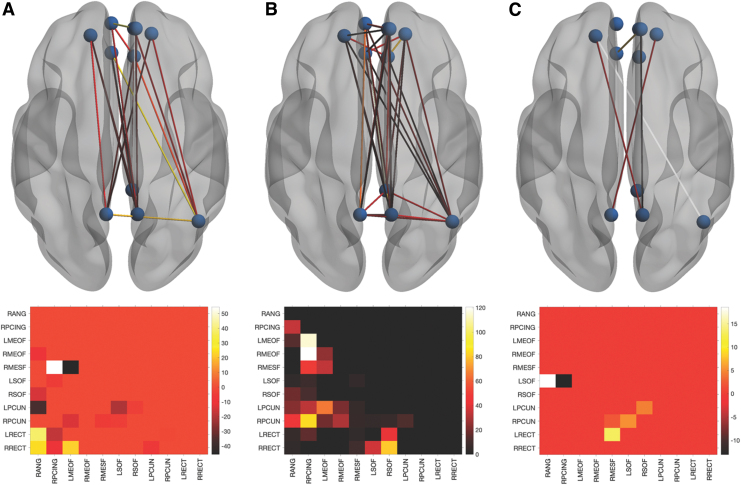
FIG. 1.
Local DMN functional connectivity. Differences in edge centrality represented in the upper row by ball and stick models with all 11 nodes as spheres and significant edges as lines. The bottom row presents the corresponding lower triangle heatmap representing the mean difference (control minus breast cancer). At Time 1 (A), the breast cancer group showed several edges with significantly higher (negative value, darker color) or lower (positive value, lighter color) centrality compared with controls (p < 0.013, FDR corrected). At Time 2 (B), there were even more group differences characterized by exclusively lower edge centrality in the breast cancer group (p < 0.0001, FDR corrected). There was a significant group-by-time effect (C) for several edges (p < 0.003, FDR corrected). DMN, default mode network; FDR, false discovery rate; L/RMEOF, left/right medial orbital frontal; L/RPCUN, left/right precuneus; L/RRECT, left/right rectus gyrus; L/RSOF, left/right superior orbital frontal; RANG, right angular gyrus; RMESF, right medial superior frontal; RPCING, right posterior cingulate. Color images are available online.

